

1. Introduction
The rapid digital transformation of business operations has reshaped inventory management practices, shifting from manual record-keeping toward integrated information systems. Despite this shift, many Micro, Small, and Medium Enterprises (MSMEs) continue to rely on conventional recording mechanisms , leading to data inconsistencies, delayed stock updates, and limited analytical capability for procurement planning . Manual inventory administration increases the likelihood of recording errors, redundancy, and information loss , thereby constraining operational efficiency and strategic decision-making .
Beyond digitalization, effective inventory management requires quantitative decision-support mechanisms . In many MSME environments, procurement decisions rely on heuristics rather than systematic cost analysis , frequently resulting in overstocking that elevates holding costs or understocking that disrupts operational continuity and customer service quality . The Economic Order Quantity (EOQ) model provides a prescriptive optimization framework for determining cost-efficient order quantities and reorder points by balancing ordering and holding costs . However, EOQ assumes relatively stable demand patterns and does not inherently capture dynamic market fluctuations .
To address demand variability, predictive analytics techniques such as the ccmodel provide a robust time-series forecasting approach based on historical transaction data . ARIMA enables multi-period demand prediction and has been widely applied in retail demand forecasting and inventory planning contexts . Integrating ARIMA-based forecasting with EOQ-based cost optimization can enhance inventory decision accuracy by combining predictive and prescriptive analytics within a unified system architecture .
Although prior studies have examined inventory optimization independently and demand forecasting separately , limited research has integrated EOQ and ARIMA within a web-based platform specifically tailored to MSME environments. In educational retail settings, inventory systems can also serve as experiential learning tools that support data-driven decision-making.
Accordingly, this study designs and develops a web-based inventory information system that integrates EOQ and ARIMA methods to support data-driven procurement planning. The system is deployed within the UNP Mart environment as a case study of an educational enterprise to improve inventory efficiency, enable real-time transaction monitoring, and facilitate predictive-based reorder decisions.
2. Methods
2.1. Research Design
This study adopted a Research and Development (R&D) methodology employing the Prototype Model to design, implement, and evaluate a web-based inventory information system. The Prototype Model is widely utilized in software engineering to iteratively refine system functionality through continuous user feedback and requirement validation . This approach is particularly appropriate for organizational information system development, where user requirements tend to evolve throughout the implementation lifecycle .
The methodological framework consisted of five iterative phases, as illustrated in Figure 1. The initial communication phase involved systematically eliciting requirements from UNP Mart stakeholders, including administrative and operational personnel, to define both functional and non-functional system specifications.
During the quick design phase, preliminary interface prototypes and workflow schemas were constructed to conceptualize user–system interactions. The modeling phase subsequently formalized the system architecture using Unified Modeling Language (UML), defining structural entities, behavioral processes, and data relationships. The construction phase entailed implementing the web-based application and embedding the EOQ and ARIMA computational modules within the established architecture. The final deployment and feedback phase incorporated functional testing, user validation, and iterative refinement to ensure system reliability, usability, and conformity with operational requirements.
2.2 Data Source
Operational data were obtained from UNP Mart’s internal records, including: (1) Master data (products, suppliers, categories); (2) Historical transaction data (goods incoming and outgoing). Time-series sales data were used to train the ARIMA forecasting model. These data represent chronological demand observations required for time-series modeling .
2.3 System Modeling and Design
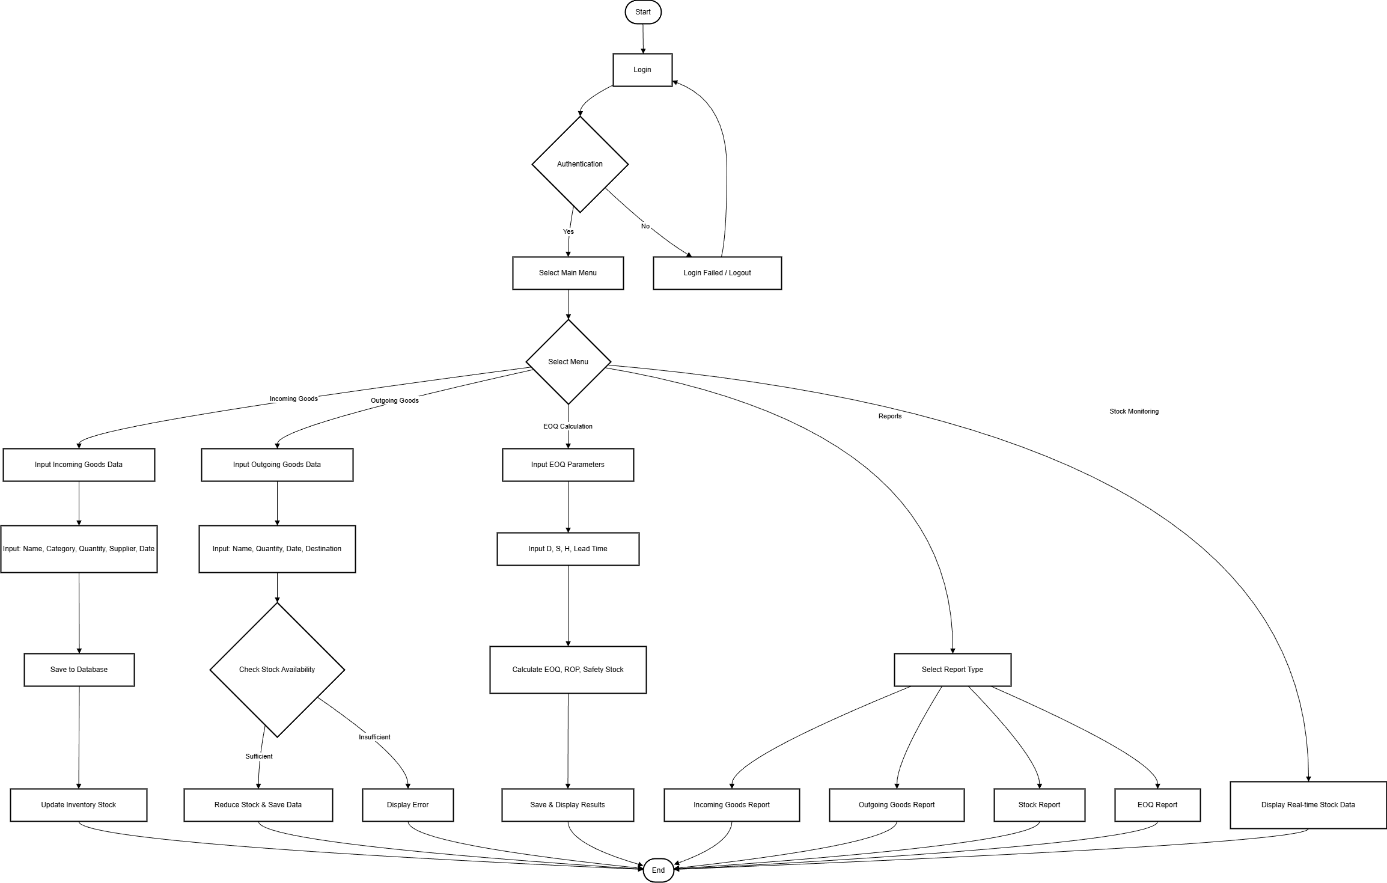
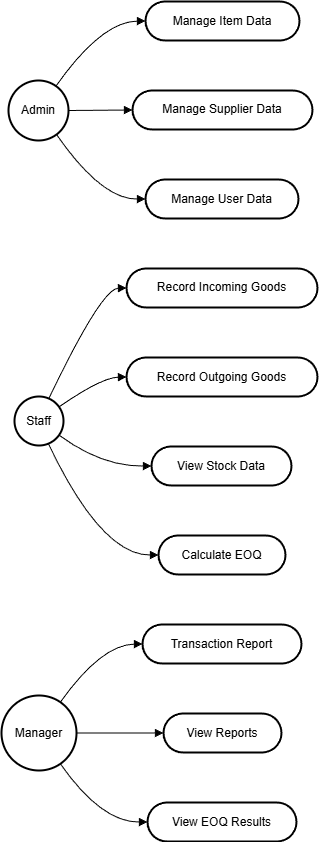
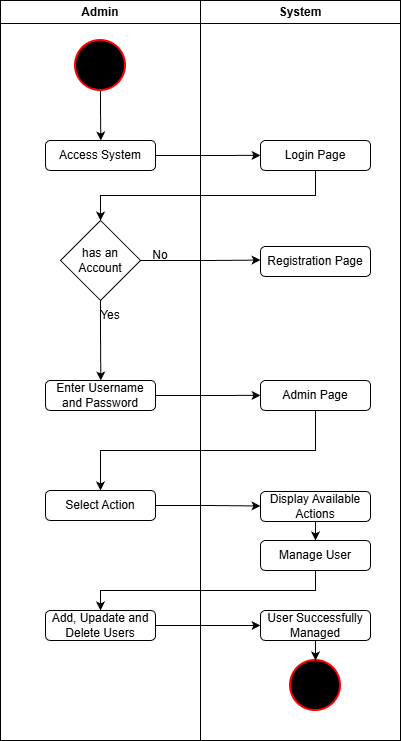
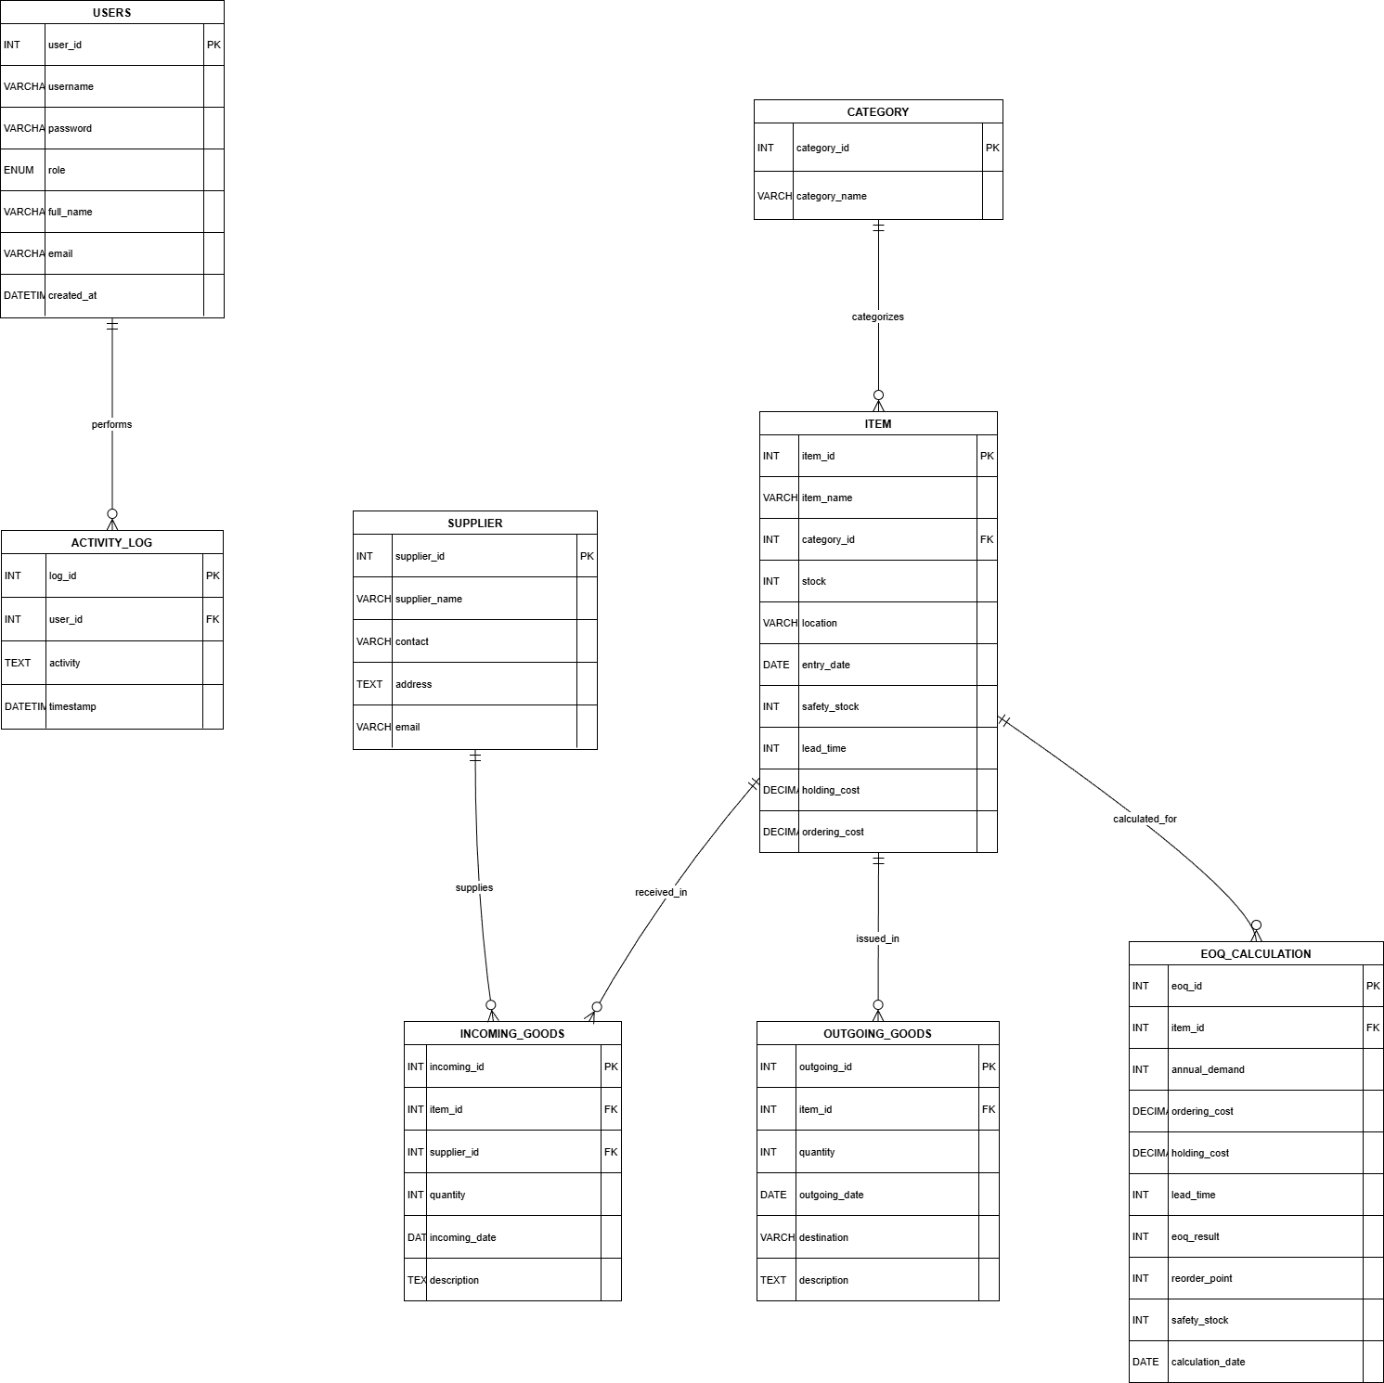
This phase focused on defining the structural and behavioral architecture of the proposed inventory system using Unified Modeling Language (UML). The modeling process was intended to ensure clarity in system logic, user interaction, and data structure prior to implementation. The diagrams developed include a system flowchart, use case diagram, activity diagram, and class diagram. Each diagram represents a different level of abstraction in the system design, ranging from procedural workflows to object-oriented structures.
2.3.1 System Flowchart
The system flowchart was developed to represent the overall logical sequence of operations within the inventory application. The flow begins with user authentication, where registered users log in based on their assigned roles. After successful login, users can access master data management features, record inbound and outbound transactions, and initiate forecasting and inventory optimization processes. The forecasting module uses the ARIMA model to process historical sales data and generate predicted demand. The predicted demand is then forwarded to the EOQ module to compute optimal order quantity, Reorder Point (ROP), and Safety Stock values. The final stage involves generating reports and visualizing inventory status.
2.3.2 Use Case Diagram
The Use Case diagram defines the interaction between system actors and core functionalities. Three primary actors were identified: Admin, Staff, and Manager. The Admin has full access to manage master data, configure system parameters, and supervise forecasting and EOQ execution. The Staff is responsible for recording inbound and outbound goods transactions and initiating calculations as necessary. The Manager primarily accesses reporting features to review forecasting results, inventory levels, and optimization outputs.
2.3.3 Activity Diagram
The Activity diagram was created to visualize the system’s operational workflow. It describes the step-by-step activities performed by users, from login verification to transaction recording, and extends to forecasting and EOQ computation procedures. Decision nodes represent validation checks, such as verifying transaction completeness before updating stock levels or confirming that forecasting is ready before running an ARIMA model.
2.3.4 Class Diagram
The Class diagram models the system’s object-oriented structure by defining core entities, attributes, methods, and relationships. Key classes include User, Product, Supplier, Category, Transaction, Forecast, and InventoryCalculation. Relationships among these classes reflect database associations such as one-to-many and relational dependencies. For instance, the Transaction class is linked to the Product class, while forecasting outputs are associated with historical transaction records.
2.4 ARIMA Modeling Procedure
The Autoregressive Integrated Moving Average (ARIMA) model was employed for demand forecasting due to its robustness in modeling univariate time-series data with autocorrelation structures .
The modeling process consisted of:
-
Stationarity Testing. The Augmented Dickey-Fuller (ADF) test was applied to evaluate data stationarity . Differencing was performed when necessary to achieve stationarity.
-
Model Identification. The autoregressive (p), differencing (d), and moving average (q) parameters were determined using Autocorrelation Function (ACF) and Partial Autocorrelation Function (PACF) plots .
-
Model Estimation and Selection. Competing ARIMA models were compared using Akaike Information Criterion (AIC) and Bayesian Information Criterion (BIC) to select the optimal model .
-
Forecast Evaluation. Model accuracy was assessed using:
-
Mean Absolute Percentage Error (MAPE)
-
Root Mean Square Error (RMSE)
-
Mean Absolute Error (MAE)
These metrics are standard measures for evaluating forecasting performance in inventory management contexts. The final forecast output provided the Annual Demand (D) parameter for EOQ calculation.
2.5 EOQ Modeling
The Economic Order Quantity (EOQ) model was applied to determine the optimal order quantity minimizing total inventory cost . The EOQ formula (1) is:
|
|
(1) |
|---|
In the EOQ formulation, represents the annual demand obtained from the ARIMA forecasting output, denotes the ordering cost per order, and H refers to the holding cost per unit per year. The Reorder Point (ROP) was calculated as ROP = dL + SS, where d is the average daily demand, is the lead time. To account for demand uncertainty during the replenishment period, Safety Stock (SS) was determined using a probabilistic demand-variability approach (2):
Where denotes the service level factor corresponding to the desired probability of avoiding stockouts, represents the standard deviation of daily demand, and adjusts demand variability over the lead-time horizon, assuming independent daily demand.
The system’s integration mechanism follows a sequential analytical flow: historical transaction data are processed through the ARIMA forecasting engine to generate predicted demand (D), which then serves as the primary input for the EOQ calculation to determine the optimal order quantity and corresponding ROP values. While the EOQ model assumes deterministic cost parameters and relatively stable ordering conditions , incorporating ARIMA forecasting enhances the system’s responsiveness to demand variability and improves the robustness of inventory decision-making under dynamic conditions .
Safety Stock (SS) was determined using a demand-variability approach based on the standard deviation of demand during lead time, formulated as:
2.6 System Development
The application was implemented using a Model-View-Controller (MVC) architecture with CodeIgniter 3 (PHP) for the backend logic and MySQL for the relational database. Bootstrap was utilized to ensure a responsive interface design. A Python-based forecasting engine performed ARIMA modeling and communicated with the web application via an API.
2.7 System Testing and Validation
We validated the system using multiple complementary approaches. We conducted Black-Box Testing to verify all features functionally without examining the source code, ensuring compliance with predefined specifications. We also conducted User Acceptance Testing (UAT), allowing end users to assess system usability and the appropriateness of functional operations. To evaluate forecasting accuracy, we compared ARIMA performance metrics, including Mean Absolute Percentage Error (MAPE) and Root Mean Square Error (RMSE), with actual demand values. We assessed system effectiveness by examining the functional pass rate from Black Box Testing to confirm that all features operated according to specifications, the ARIMA model’s forecast accuracy to ensure predicted demand closely matched historical patterns, and the logical consistency of EOQ-derived Reorder Point (ROP) and Safety Stock values to verify that optimization outputs were mathematically sound and operationally feasible. Together, these validation steps demonstrate that we developed a system that is technically robust, analytically reliable, and practically applicable for data-driven procurement decision-making.
3. Results
3.1. System Implementation
The proposed inventory information system was successfully implemented as a web-based application integrating PHP (CodeIgniter 3) and a Python-based analytical engine. The system used MySQL as the relational database management system and Bootstrap 5.3.3 to ensure a responsive user interface. The implementation phase translated the UML-based system model into a functional application architecture based on the Model–View–Controller (MVC) paradigm.
The system integrates operational transaction processing with predictive (ARIMA) and prescriptive (EOQ) analytics within a unified platform.
3.1.1. User Interface and Data Management
The system entry point is the Login Page, which authenticates users through role-based access control. Two primary roles were implemented: Admin, who has full system access, including forecasting and EOQ calculation features, and Staff, who have access limited to transaction recording and operational data entry. Upon successful authentication, users are redirected to the Dashboard, which presents real-time summaries of total items, categories, and suppliers, along with graphical transaction visualizations to support monitoring and decision-making. In addition to Admin and Staff roles, a Manager role was implemented with read-only access to reporting, forecasting results, and inventory summaries.
Master data management is organized into structured modules to ensure data integrity and analytical readiness.
-
Master Goods Data
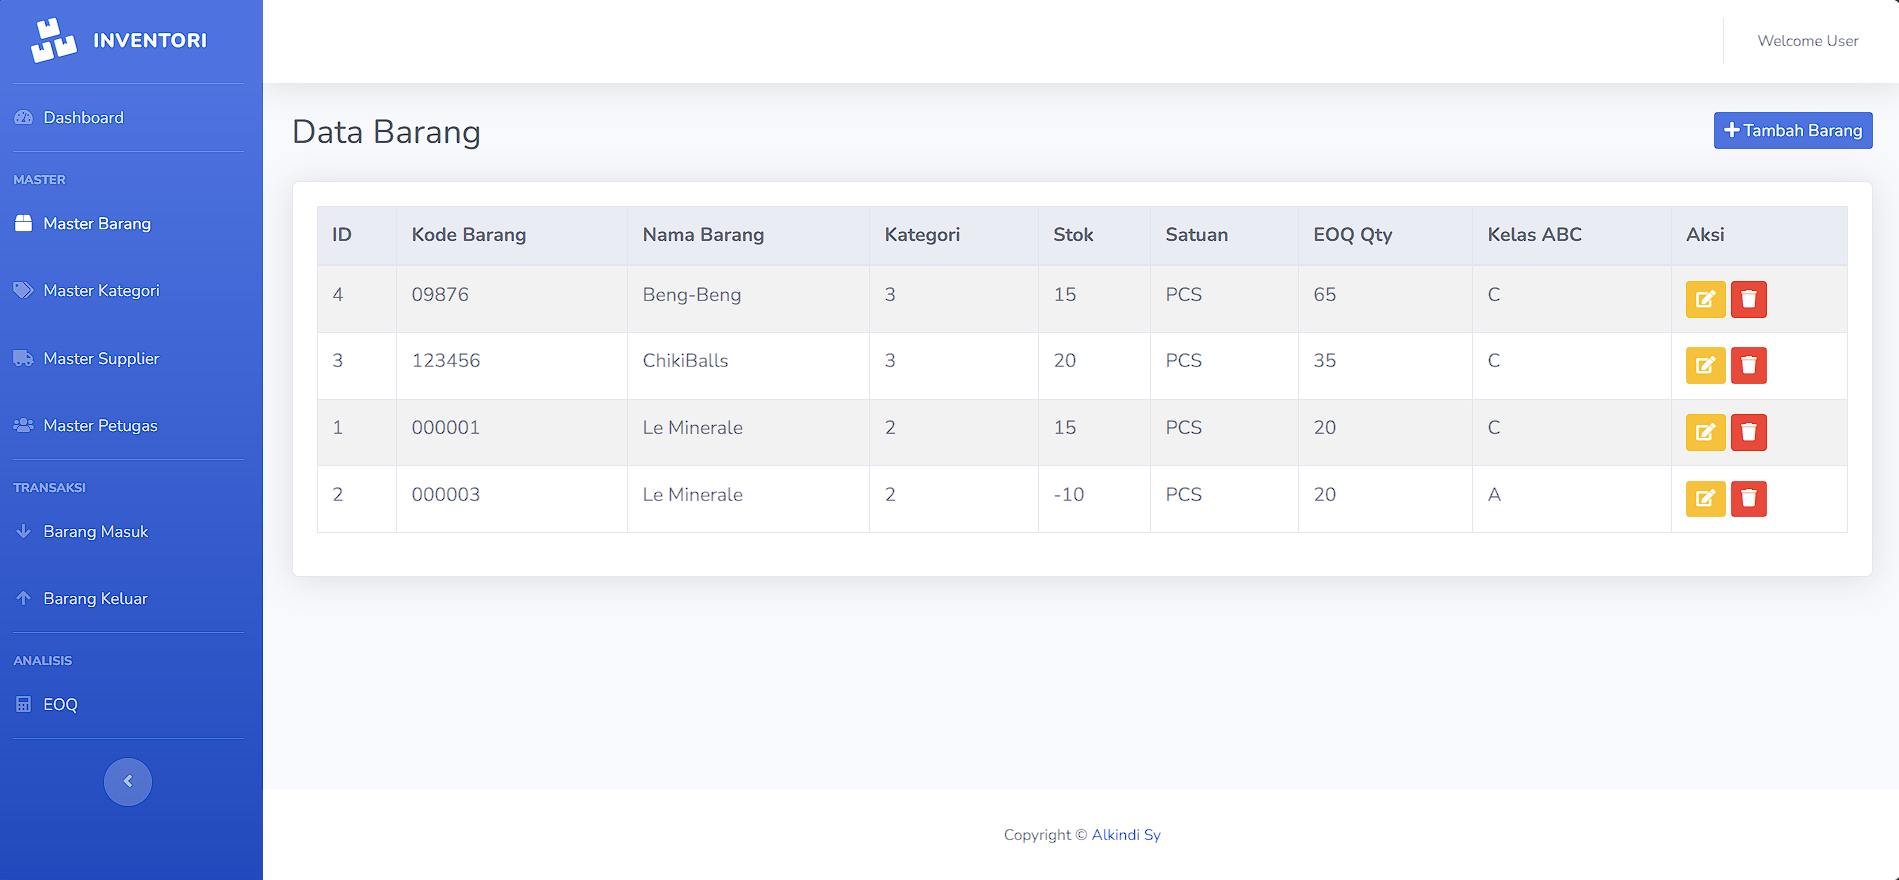
The Master Goods module manages detailed item attributes, including stock levels, storage location, ordering cost (S), holding cost (H), and lead time parameters required for EOQ computation. As shown in Figure 6, the interface allows administrators to add, edit, and update inventory parameters systematically. These cost-related fields serve as validated inputs for subsequent optimization processes.
-
Supplier Data
The Supplier Data module stores supplier profiles and establishes relational links with incoming transaction records. As illustrated in Figure 7, this interface ensures traceability of procurement activities and supports supplier-based transaction monitoring. The structured linkage between supplier data and goods transactions enhances accountability and improves historical procurement tracking.
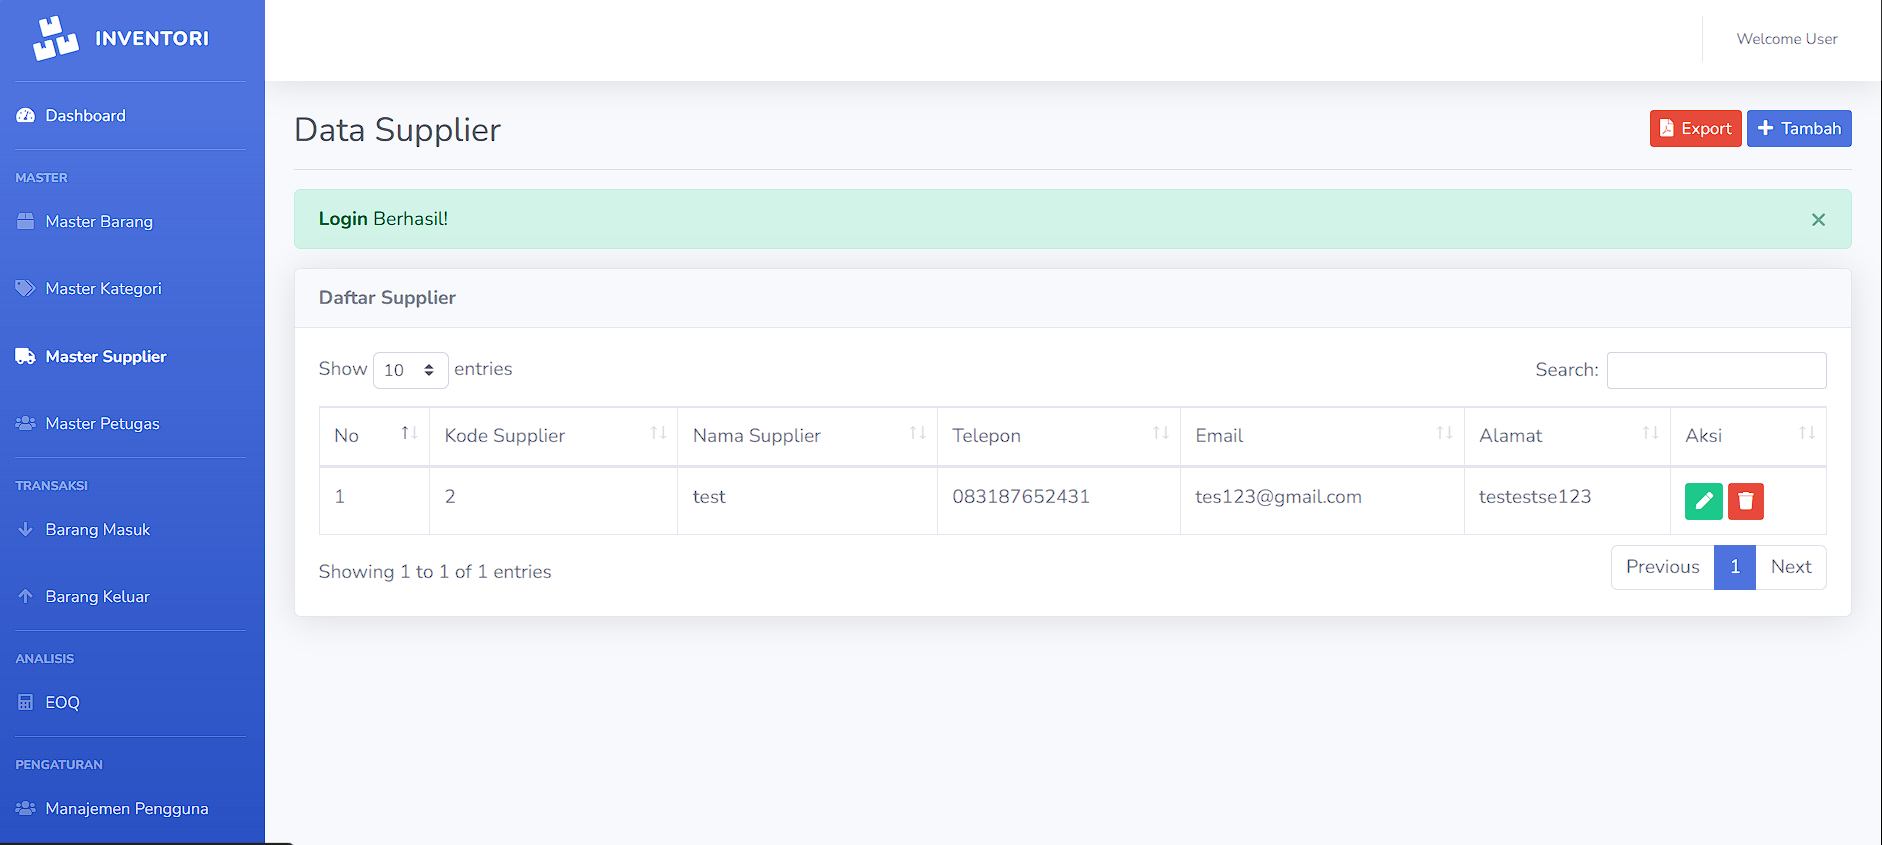
The structured master data configuration, as depicted in Figures 6 and 7, ensures database consistency and provides validated inputs for forecasting and inventory optimization calculations. By centralizing cost parameters and supplier associations within controlled modules, the system minimizes data redundancy and reduces the risk of analytical inconsistencies during ARIMA and EOQ processing.
3.1.2 Transaction Management
The transaction module handles real-time inventory movement through two primary processes:
-
Goods Incoming
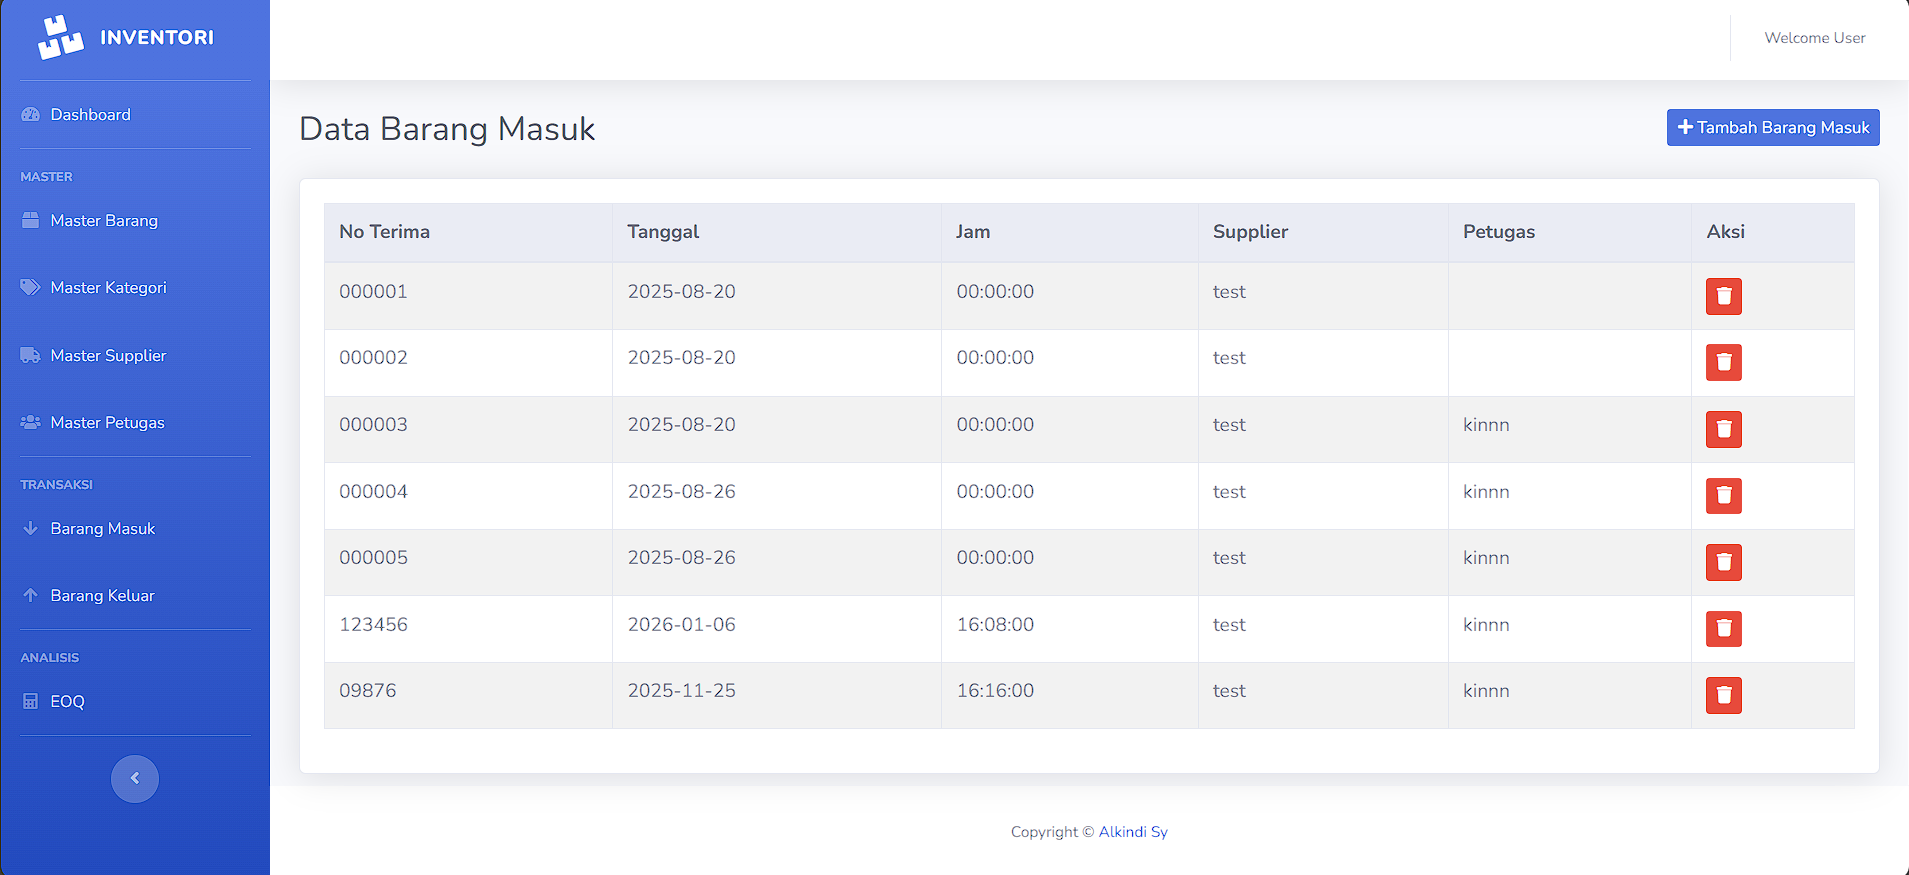
For goods incoming, staff record items received from suppliers, and upon submission, the system automatically updates stock levels and logs the transaction in the database, as shown in Figure 8.
-
Goods Outgoing
For goods outgoing, the system verifies stock availability before reducing inventory levels, preventing negative stock conditions and ensuring computational consistency for forecasting, as illustrated in Figure 9.
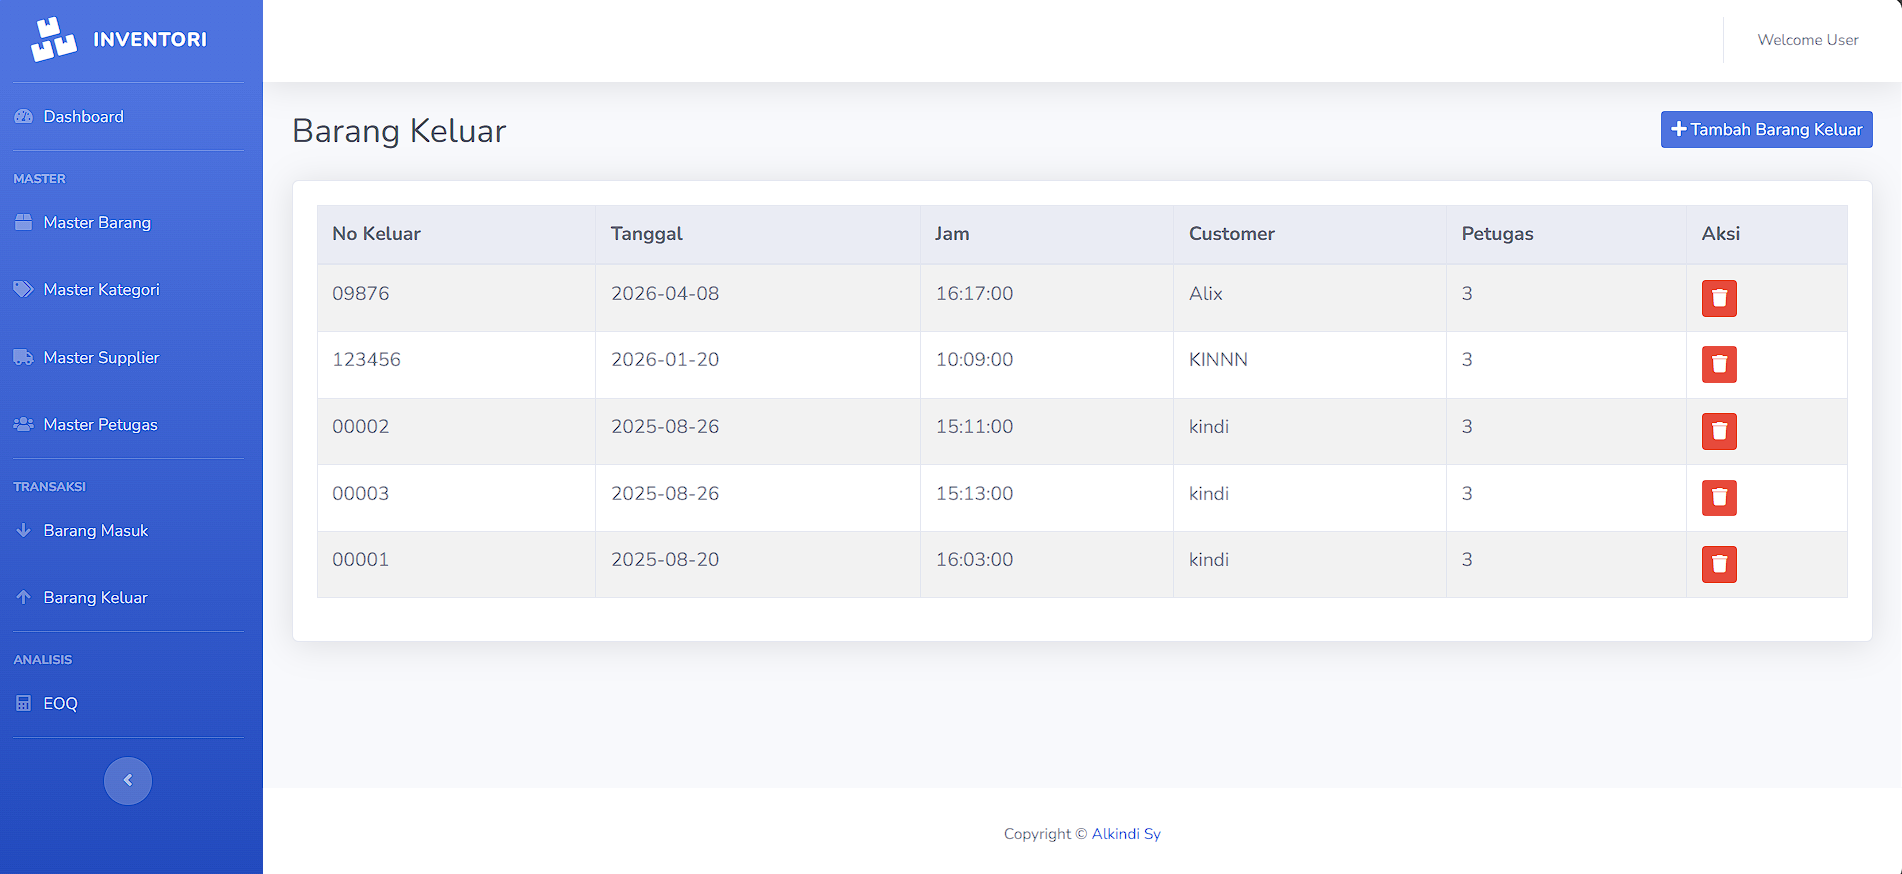
The automatic synchronization between transaction logs and master stock data ensures that historical sales data used for forecasting remains accurate and up to date.
3.2 ARIMA Prediction and EOQ Calculation Results
The system integrates a Python-based forecasting engine that uses the ARIMA model to predict time-series demand. The computational process begins by extracting historical sales data from the “Goods Out” transaction table, which serves as the primary time-series input. The ARIMA engine processes these data to estimate future demand levels and produces the projected Annual Demand parameter (D). The predicted demand is subsequently transmitted to the EOQ module, where it is combined with ordering cost (S) and holding cost (H) parameters stored in the master data to compute optimal inventory decisions.
To evaluate forecasting performance, model accuracy was assessed using the Mean Absolute Percentage Error (MAPE), the Root Mean Square Error (RMSE), and the Mean Absolute Error (MAE). The evaluation results are presented in Table 1.
|
Metric |
Value |
|---|---|
|
MAPE |
8.47% |
|
RMSE |
124.36 units |
|
MAE |
96.21 units |
Based on AIC and BIC comparison, the ARIMA(1,1,1) model was selected as the optimal specification for forecasting demand. The MAPE value below 10% indicates that the ARIMA model provides high forecasting accuracy and is suitable for operational inventory planning. The relatively low MAE and RMSE values further confirm that prediction deviations remain within an acceptable operational tolerance range.
Based on this integrated analytical process, the system generates three principal optimization outputs: the Optimal Order Quantity (Q*), representing the most economical purchase quantity per replenishment cycle; the Reorder Point (ROP), calculated as the product of average daily demand and lead time plus Safety Stock; and the Safety Stock (SS), which functions as a protective buffer against uncertainty during replenishment periods. Safety Stock was computed using the demand standard deviation during the lead time to accommodate demand variability and reduce stockout risk.
To evaluate the financial implications of the optimization approach, a comparative cost simulation was conducted between the existing ordering policy and the EOQ-based policy. The comparison was simulated over a one-year operational period using projected annual demand derived from the ARIMA forecast. The results are summarized in Table 2.
|
Scenario |
Ordering Cost |
Holding Cost |
Total Inventory Cost |
|---|---|---|---|
|
Existing Policy |
12,500 |
18,300 |
30,800 |
|
EOQ-Based Policy |
9,200 |
14,600 |
23,800 |
|
Cost Reduction |
22.73% |
The implementation of the EOQ-based policy resulted in a total inventory cost reduction of approximately 22.73%, indicating improved cost efficiency through optimized order sizing and inventory balancing. All calculated values are presented on a dedicated EOQ Calculation page, where users can review detailed results and export them as PDFs for reporting and managerial evaluation.
3.3 Application Testing Results
We conducted functional validation using Black-Box Testing to verify that the system complied with all predefined requirements. Our evaluation emphasized input–process–output verification across the system’s critical modules, including user authentication, CRUD operations for goods, transaction processing, ARIMA-based forecasting, and EOQ-based inventory optimization. Each module was tested against realistic operational scenarios to ensure that the system could handle typical and exceptional use cases effectively. Table 3 summarizes the tested features, corresponding scenarios, expected results, and validation outcomes.
During testing, we simulated various interactions, such as adding, editing, and deleting product data; recording incoming and outgoing stock transactions; executing EOQ calculations to generate optimal order quantities, Reorder Points (ROP), and Safety Stock (SS); and running ARIMA-based demand forecasting. We also verified that the system correctly handled invalid inputs, such as incorrect login credentials or transaction anomalies, and produced appropriate error messages. All modules successfully met their expected outcomes, indicating that the system processed data accurately, maintained data integrity, and performed computations reliably.
|
Feature |
Test Scenario |
Expected Result |
Status |
|---|---|---|---|
|
Login System |
Valid & invalid credentials |
Access granted/error message |
Pass |
|
CRUD Goods |
Add/edit/delete items |
Data correctly stored & updated |
Pass |
|
Transaction Module |
Record incoming/outgoing |
Stock auto-updated correctly |
Pass |
|
EOQ Calculation |
Execute optimization |
EOQ, ROP, and SS were correctly generated |
Pass |
|
ARIMA Prediction |
Execute forecasting |
Forecast trend displayed |
Pass |
We observed that all tested features passed the validation criteria, confirming that the system functions as intended and satisfies both operational and analytical requirements. Beyond functional correctness, we verified that users can access detailed test results and export them as PDFs for reporting and managerial evaluation, supporting transparency and traceability of system operations. These results demonstrate that we successfully implemented a robust, reliable, and user-oriented inventory management system that supports data-driven decision-making, enhances operational efficiency, and provides actionable insights for inventory control in MSME contexts.
4. Discussion
4.1 Forecasting Validity and Demand Dynamics
The selection of ARIMA(1,1,1) based on AIC and BIC criteria indicates that the demand series contains autoregressive and moving-average components and requires first-order differencing to achieve stationarity. This suggests that demand patterns are stochastic but structurally dependent over time, rather than purely random or strictly deterministic. Such characteristics justify using time-series modeling over naive averaging techniques, which assume static demand behavior [14], [15], [16]. Prior studies consistently demonstrate that ARIMA provides reliable short- to medium-term forecasting where linear temporal dependence dominates demand fluctuations [19], [20].
The achieved MAPE of 8.47% falls within the high-accuracy category for managerial applications. In inventory systems, forecast error directly affects replenishment decisions because predicted demand propagates into order quantity and Reorder Point (ROP) calculations. Relatively low MAE and RMSE values indicate that forecast deviations remain within operationally tolerable limits, which is critical for maintaining service level targets without excessive buffer stock. These findings underscore that forecasting quality constitutes a foundational determinant of inventory optimization effectiveness [24], [25].
4.2 Integration of Predictive and Prescriptive Analytics
Integrating ARIMA forecasting with the EOQ model establishes a structured link between predictive analytics and prescriptive optimization. Classical EOQ theory assumes deterministic demand and constant cost parameters [12], [13]. In practice, however, demand uncertainty undermines the validity of static inputs. Embedding forecast-derived annual demand into EOQ makes a traditionally fixed parameter dynamically estimated, improving replenishment decision accuracy.
This integration reflects a broader methodological shift in operations management, where predictive models inform optimization engines to enhance decision robustness. Historical data inform demand forecasts, forecasts inform replenishment parameters, and optimization outputs guide procurement actions. Such a closed-loop architecture aligns with contemporary research advocating data-driven inventory control frameworks that combine forecasting accuracy with cost-minimization logic [10], [17].
4.3 Risk Buffering Through Probabilistic Safety Stock
The incorporation of probabilistic Safety Stock enhances inventory resilience by explicitly accounting for demand variability during the replenishment period. By scaling the standard deviation of daily demand over lead time and adjusting with the service level factor Z, the system translates stochastic demand patterns into quantifiable inventory buffers. This approach aligns with established principles in stochastic inventory control, where safety stock functions as a risk-mitigation mechanism that balances the likelihood of stockouts against holding-cost exposure [11], [30].
Crucially, the buffer is calibrated to predefined service level objectives rather than relying on arbitrary heuristics or fixed percentages. This calibration ensures that the probability of stockouts remains within managerial tolerance limits, providing a defensible and analytically grounded method for mitigating risk. In contexts where demand variability constitutes the principal source of uncertainty, probabilistic adjustments offer superior control compared with ad hoc or reactive buffer policies. As a result, inventory management shifts from corrective responses to proactive, quantitatively justified risk management, enhancing both operational reliability and cost efficiency [5], [6], [17].
The incorporation of probabilistic Safety Stock further strengthens inventory resilience. By scaling the standard deviation of daily demand over the lead time and adjusting it with the service level factor Z, the system explicitly models demand variability over the replenishment horizon. This approach is consistent with stochastic inventory control theory, in which safety stock serves as a risk-mitigation mechanism that balances the probability of stockouts and holding-cost exposure.
Importantly, the buffering mechanism is calibrated to service level objectives rather than arbitrary percentage adjustments. This ensures that stockout risk remains within managerial tolerance thresholds. In environments where demand variability is the primary source of uncertainty, such probabilistic adjustments are more defensible than heuristic buffer additions. Consequently, inventory control shifts from reactive correction toward quantitatively grounded risk management.
4.4 Economic Impact of Integrated Optimization
The one-year cost simulation revealed a 22.73% reduction in total inventory costs under the EOQ-based policy compared with the existing ordering approach. This improvement suggests that prior procurement practices relied on heuristic rules, fixed intervals, or experience-based judgment rather than total-cost minimization principles [9], [10].
The observed cost reduction arises not solely from order quantity optimization but also from the interaction among accurate demand estimation, probabilistic buffering, and optimized replenishment intervals. This confirms that forecasting and optimization function as interdependent components of an integrated system, producing measurable financial benefits and improving transparency in decision-making [11], [12], [17].
4.5 System Architecture and Practical Feasibility
From an implementation standpoint, the system demonstrates that advanced analytical integration can be operationalized using standard web technologies. The Model-View-Controller (MVC) architecture in CodeIgniter 3 separates business logic and presentation layers, facilitating maintainability and scalability [7]. Integrating a Python-based forecasting engine with a PHP-based web framework confirms that traditional web stacks can effectively accommodate modern data science tools [9], [23].
This hybrid architecture enhances accessibility and enables role-based access to real-time inventory information across devices. Such accessibility is particularly relevant for MSMEs transitioning from manual or spreadsheet-based systems toward digital platforms [1], [2], [3].
4.6 Limitations and Future Directions
Despite positive results, several limitations warrant acknowledgment. The EOQ model assumes constant ordering and holding costs, which may not reflect real-world fluctuations such as quantity discounts or supply chain disruptions [12], [30]. ARIMA captures linear temporal dependencies but does not explicitly incorporate exogenous factors such as promotions or macroeconomic shocks [24], [26]. In demand environments characterized by seasonality or structural breaks, extended models such as SARIMA or hybrid machine-learning approaches may yield superior forecasting performance [28].
The cost simulation was conducted over a one-year operational horizon. Longer-term validation is necessary to assess robustness under variable economic conditions. Future research may explore multi-period validation, multi-warehouse coordination, comparative analysis with advanced forecasting techniques, and integration with emerging AI-driven predictive models [14], [19], [20], [26].
5. Conclusion
This study developed and implemented a web-based inventory information system that integrates ARIMA demand forecasting with EOQ-based inventory optimization. The system successfully operationalizes a structured analytical workflow in which historical transaction data generate statistically validated demand forecasts, which subsequently inform optimal order quantity, reorder point, and safety stock calculations. Empirical evaluation demonstrates that the ARIMA model achieved high forecasting accuracy, while the integrated EOQ policy reduced total inventory cost by 22.73% compared with the existing ordering approach. These findings indicate that combining predictive analytics with prescriptive optimization enhances both operational efficiency and financial performance. Beyond algorithmic performance, the study illustrates the practical feasibility of integrating data science tools within a web-based enterprise system architecture. The transition from manual recording practices to an analytically driven decision-support system represents not merely technological modernization but a structural shift toward data-driven management. Future development should focus on extending forecasting capabilities with advanced models, incorporating multi-location inventory coordination, and conducting long-term empirical validation to strengthen generalizability.
Declarations
Author Contributions
Alkindi Syamsi: Conceptualization; Methodology; Software; Investigation; Data Curation; Visualization; Writing – Original Draft; Writing – Review & Editing. Dedy Irfan: Supervision; Validation; Formal Analysis; Writing – Review & Editing. Dony Novaliendry: Validation; Formal Analysis; Writing – Review & Editing. Randi Proska Sandra: Validation; Formal Analysis; Writing – Review & Editing. All authors have read and approved the final version of the manuscript.
Acknowledgments
The authors express their sincere appreciation to the management and staff of UNP Mart for their cooperation during the data collection process and for granting access to the operational records required for this study. Their insights during the communication and requirements analysis phases substantially contributed to the development of the web-based inventory information system.
Ethical Approval
This study involves the design and development of a web-based inventory information system and does not include biological, medical, or psychological experimentation involving human or animal subjects. The research employed the Prototype Model for software development, including system construction and testing phases. Data collection was limited to non-sensitive historical transaction records and structured interviews with authorized personnel (administrative staff and system users) at UNP Mart. Institutional permission for data usage was obtained. Formal ethical clearance was not required under applicable research guidelines.
Informed Consent
Permission to access historical transaction data and operational records was formally granted by UNP Mart management. Participation by staff members during the communication and User Acceptance Testing (UAT) stages was voluntary and conducted solely for system requirement validation.
Funding
The authors declare that this research was conducted without external funding. All stages of system development, including implementation using CodeIgniter and MySQL, were carried out independently.
Data Availability Statement
The datasets supporting this study's findings, including historical transaction logs and master data used for ARIMA forecasting and EOQ calculations, were provided by UNP Mart. Due to commercial confidentiality and operational privacy considerations, these data are not publicly available. Aggregated testing results and methodological details are presented within the manuscript.
Competing Interests
The authors confirm that there are no conflicts of interest, financial or otherwise, that could have influenced the research or the outcomes reported in this study.
Generative AI and AI-Assisted Technologies Statement
During the preparation of this manuscript, generative AI tools were used solely to assist with language editing and proofreading. All outputs were critically reviewed, revised, and validated by the authors to ensure academic integrity, originality, and accuracy.
References
Author Biographies

Alkindi Syamsi is an undergraduate student in the Informatics Program at the Faculty of Engineering, Universitas Negeri Padang, Indonesia. Currently in his ninth semester, he has developed academic expertise in information technology, with primary interests in web development, artificial intelligence, and game development. He has actively participated in academic competitions and was Runner-Up in a web design competition, where he designed and developed a web-based system. His academic focus centers on the development and implementation of computational technologies in practical digital systems.



Dedy Irfan is a faculty member at the Faculty of Engineering, Universitas Negeri Padang, Indonesia. His academic expertise includes information systems, educational technology, and web-based application development. His research focuses on applied computing, technology-enhanced learning, and system development in engineering education contexts.




Dony Novaliendry is a faculty member at the Faculty of Engineering, Universitas Negeri Padang (UNP), Indonesia. His research interests include artificial intelligence, machine learning, data mining, image processing, and technology-enhanced learning. He is actively engaged in developing intelligent educational applications and in international research collaborations in computing and educational technology.




Randi Proska Sandra is a faculty member in the Department of Electronics Engineering, Universitas Negeri Padang, Indonesia. His research expertise includes programming education, human-centered computing, and social informatics. He has served as a Visiting Research Fellow at NTNU, Norway, and holds an academic background from National Central University, Taiwan. He has contributed as an Editorial Board Member for SAGE and as a reviewer for leading ACM conferences, including CSCW and SIGCSE. His scholarly work emphasizes the dissemination of educational technology and computer science research at the international level.



Publisher’s and Journal’s Note
Sagamedia Teknologi Nusantara, as the publisher and editor of the Journal of Hypermedia & Technology-Enhanced Learning (J-HyTEL), upholds the highest ethical standards in academic publishing. The journal remains neutral with regard to jurisdictional claims in published maps and institutional affiliations. Authors are fully responsible for the originality, accuracy, and integrity of their work. Post-publication ethical concerns will be addressed through corrections, clarifications, or retractions as necessary. The content of this publication has not been approved by the United Nations and does not reflect the views of the United Nations or its officials or Member States. https://www.un.org/sustainabledevelopment
Copyright & License

© 2026 Alkindi Syamsi, Dedy Irfan, Dony Novaliendry, Randi Proska Sandra. Authors retain copyright.
This article is licensed under a Creative Commons Attribution 4.0 International License, which permits use, sharing, adaptation, distribution, and reproduction in any medium or format, provided that appropriate credit is given to the original author(s) and the source, a link to the Creative Commons license is provided, and any modifications are indicated. Unless otherwise specified in a credit line, this article’s images or other third-party material are included under the Creative Commons license. If certain material is not covered by the article’s Creative Commons license and its intended use is not permitted by statutory regulation or exceeds the allowed usage, permission must be obtained directly from the copyright holder. http://creativecommons.org/licenses/by/4.0/.
Read the licence terms