

1. Introduction
Municipal solid waste management is increasingly dependent on the quality, continuity, and governance of information. In developing regions, waste-management systems must respond simultaneously to increasing waste generation, uneven infrastructure, fragmented institutional responsibilities, and limited monitoring capacity [1]. International benchmarking work likewise identifies the availability, consistency, and comparability of municipal waste data as persistent constraints on performance assessment and cross-city evaluation [2]. Data management is therefore not merely administrative support; it is part of the operational infrastructure through which waste-management activities are coordinated, monitored, and governed.
Digital technologies can strengthen this information infrastructure by connecting data capture, monitoring, reporting, and decision-support processes. Research on smart waste management emphasizes integrated information flows, digital coordination, and data-driven management throughout the waste-management process [3], [4]. Yet the prominence of sensing, automation, artificial intelligence, and Internet of Things architectures can obscure a more immediate problem faced by many local governments. Where operational records remain dispersed across paper documents, spreadsheets, word-processing files, and individual computers, the initial priority may be to establish a coherent, controlled, and traceable information environment before pursuing advanced automation.
This challenge aligns with the broader literature on digital government. Public-sector digital transformation involves redesigning processes, responsibilities, and service arrangements around digital capabilities rather than simply converting paper procedures into electronic form [5]. Local governments therefore must reduce information silos while developing integrated systems that support coordination, managerial oversight, and accountability [6]. At the same time, technological implementation alone does not guarantee organizational transformation; outcomes depend on organizational fit, institutional conditions, user practices, and the capacity of public institutions to incorporate digital systems into routine work [7]. Foundational digitalization should therefore be examined as both a software-development problem and a socio-technical, human-centered systems problem.
These challenges were evident at the Environmental Office of Padang Pariaman Regency (Dinas Lingkungan Hidup, DLH), Indonesia, which manages waste-related information across 17 sub-districts. At the time of the study, field information was first recorded manually and then entered into spreadsheet and word-processing files stored on individual staff computers. Records concerning waste generation, reduction, handling, unhandled waste, infrastructure, and waste-bank activities were distributed across separate administrative files. Agency records for 2024 reported waste handling of 3,046.46 tons per year [8]. Two estimates of annual waste generation were also available: 100,116.449 tons derived from the 2016 technical planning document combined with 2024 population data [9], and 61,849.78 tons reported in the regional waste-policy framework [8]. These values originate from different calculation bases and are not treated as interchangeable. Their divergence nevertheless illustrates why source provenance and interpretability are essential when administrative records are fragmented.
Previous studies have addressed several aspects of this problem. Bui et al. [10] identify technological barriers affecting municipal smart-waste initiatives, while Giraldo-Almario et al. [11] emphasize data quality, quantity, and consolidation in municipal waste evaluation. Mersico et al. [12] show how a digital platform can reduce fragmentation and facilitate value co-creation among waste-management actors, whereas IoT- and deep-learning-based systems represent a more technology-intensive pathway toward real-time monitoring [13]. At the Indonesian municipal level, Yulianto and Febrianto [14] report a web-based waste-management system for Bantul that achieved complete conformance across its executed Black Box scenarios. Together, these studies show the potential value of digital platforms, integrated information, and software-enabled monitoring. However, a functioning web application or a 100% pass rate in an executed functional test set is not, by itself, evidence that fragmented administrative practices have become a governable workflow or that the system is uniformly usable, organizationally effective, or capable of producing broader public-service improvement.
The gap lies in how these applications are evaluated, not simply in whether they can be developed. Implementation studies do not always explain how observed administrative problems relate to explicit requirements, implemented controls, functional-test evidence, and user-perceived usability, or which outcomes remain unmeasured. A system can pass its specified functional tests yet still present interaction difficulties, fail to support routine work practices, or produce no demonstrated organizational improvement. Conversely, perceived usability cannot substitute for evidence that critical workflow requirements have been implemented correctly.
This distinction also establishes the human-centered relevance of the study. Waste administration is the application domain, whereas the analytical focus is the interaction between intended administrative users and a role-governed digital environment: how workflow structures, access responsibilities, traceability mechanisms, navigation, reporting, and perceived usability are combined in routine public-sector interaction. The study does not treat municipal waste management as a learning outcome. Instead, it examines foundational digitalization as a human-centered computing problem in which successful functional execution and satisfactory user experience are related but distinct forms of evidence.
Accordingly, this study examines SIPEDAS as a single-site socio-technical case for reorganizing fragmented municipal waste administration into a centralized, role-governed, and auditable digital workflow. The study focuses on the connections among administrative requirements, implemented system controls, functional conformance, and user-perceived usability.
RQ1: How can fragmented municipal waste records and reporting activities be consolidated into a traceable, role-controlled web workflow suitable for local-government use?
RQ2: What can requirement-derived functional tests and perceived-usability evidence establish about SIPEDAS, and what remains unverified?
This study contributes a structured approach to designing and evaluating foundational public-sector digitalization rather than a new algorithm or software architecture. First, it links observed administrative limitations with operational requirements, organizational roles, implemented controls, system modules, and executed functional-test scenarios. Second, it combines requirements-based functional testing with participant-level perceived-usability evidence while explicitly avoiding the assumption that successful software execution is equivalent to satisfactory human experience. Third, it offers a human-centered evaluation framework that distinguishes implemented mechanisms, tested system behavior, user perception, actual system use, and organizational net benefits. These distinctions provide a clearer basis for evaluating foundational digital-government systems.
2. Materials and Methods
2.1 Research Design, Case Context, and Evaluation Logic
This single-site software design-and-evaluation study followed the Waterfall software development life cycle. Requirements analysis drew on three sources documented in the available project record: observation of the existing field-to-agency administrative workflow, interviews with agency personnel, and review of operational/planning documents. The observed process covered field recording, agency submission, spreadsheet/word-processing entry, recapitulation, reporting, storage, and managerial review across waste generation, transportation, reduction, landfill handling, unhandled waste, infrastructure, and waste-bank activities. The document base included agency operational records, the 2016 technical waste-planning document, and regional 2024 waste-performance/planning records [8], [9].
The available documentation does not identify the full roster of requirements-elicitation interviewees, their selection procedure, interview duration, or a formal signed requirements-validation protocol. These details could not be established from the available documentation. Interviews are treated only as inputs to requirements specification, not as a qualitative dataset, and the manuscript makes no thematic or inferential claim from them. Requirement confirmation is evidenced instead by the documented functional specification, role model, database design, implemented modules, and requirement-derived test matrix. This limitation is carried explicitly into the interpretation of RQ1.
Waterfall was retained as an organizing description because the principal workflows and functional specifications were documented before implementation, enabling requirements, design, implementation, and testing to be linked sequentially [15]. Long-term maintenance was outside the empirical evaluation.
2.2 Requirements Traceability and System Design
A requirements-to-evidence traceability structure was developed to connect identified administrative problems with operational requirements, implemented system mechanisms, and the functional scenarios used for verification. Rather than presenting system features as isolated technical components, this structure makes explicit why each major capability was introduced and what evidence was available to verify its implementation. Table 1 summarizes this chain from observed workflow limitation to recorded functional test.
The system specification defined two primary authorization roles: Administrator and Employee. The Administrator role manages agency profiles, employee and leadership records, account creation, credential delivery, user status, system notifications, and audit-log access. The Employee role manages operational waste records, master data, waste-bank information, filtering, reporting, and dashboard-based monitoring. Leadership access was implemented as a monitoring view within the documented authorization structure rather than as a third primary role. This authorization structure follows role-based access-control principles, in which permissions are associated with organizational responsibilities rather than assigned independently to individual users [16]. Figure 1 summarizes the interaction boundaries.
|
ID |
Observed limitation |
Operational requirement |
Implemented response |
Recorded test IDs |
|---|---|---|---|---|
|
R1 |
Fragmented paper/spreadsheet records |
Centralized relational records and CRUD workflows |
MySQL relational schema; master and transaction modules |
T04–T06, T11–T22 |
|
R2 |
Separated activities and sub-district files |
Shared data context across modules/areas |
Master-data relationships; operational and waste-bank modules |
T10–T23 |
|
R3 |
Manual report recapitulation |
Filterable aggregation and PDF reporting |
Report module with period/area filter and export |
T23–T24 |
|
R4 |
Limited access control/accountability |
Role-governed access and attributable activity history |
Sanctum; role middleware; log_aktivitas |
T01–T02, T07, T09, T25 |
|
R5 |
Limited managerial visibility |
Consolidated monitoring views |
Operational/admin dashboards |
T03, T10 |
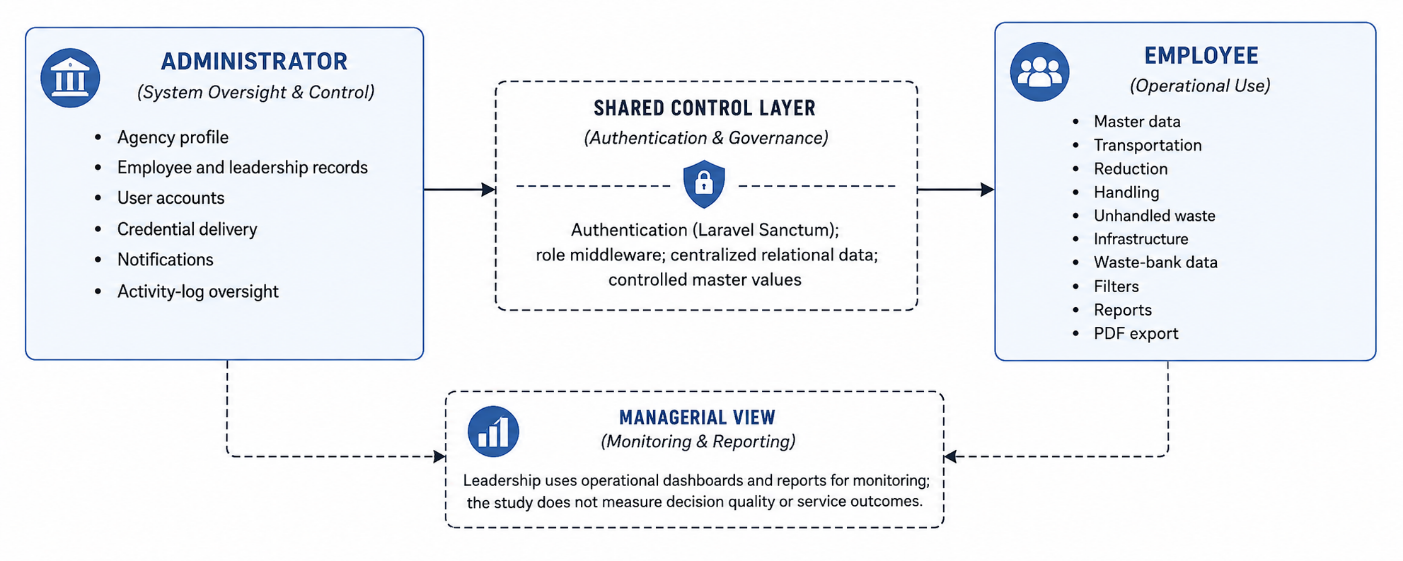
The implemented scope included authentication; administrator and waste-management dashboards; sub-district, waste-category, and landfill master data; waste-reduction, handling, and unhandled-waste records; facilities and infrastructure; waste sources and waste-generation estimates; waste-bank profiles, processing, and customer records; reporting; filtering; PDF export; notifications; activity logging; and logout. These functions were integrated around a shared relational data structure rather than implemented as independent application features. Security, usability, availability, performance, reliability, scalability, browser compatibility, and maintainability were specified as non-functional requirements or design objectives, but only functional conformance and perceived usability were empirically evaluated in the retained study record.
2.3 System Architecture, Data Integrity, and Traceability Controls
SIPEDAS was implemented as a decoupled web application designed to separate user interaction, application logic, and persistent data management. The frontend was developed using React and TypeScript, with Tailwind CSS supporting the presentation layer, while the backend was implemented in Laravel (PHP) as a RESTful API. Persistent records were maintained in a centralized MySQL relational database. This arrangement enabled the client interface to communicate with server-side business logic through structured JSON-based requests and responses while maintaining a common data layer for administrative and operational records. Figure 2 summarizes the resulting architecture and the interaction among the React/TypeScript client, Laravel RESTful API, and MySQL database.
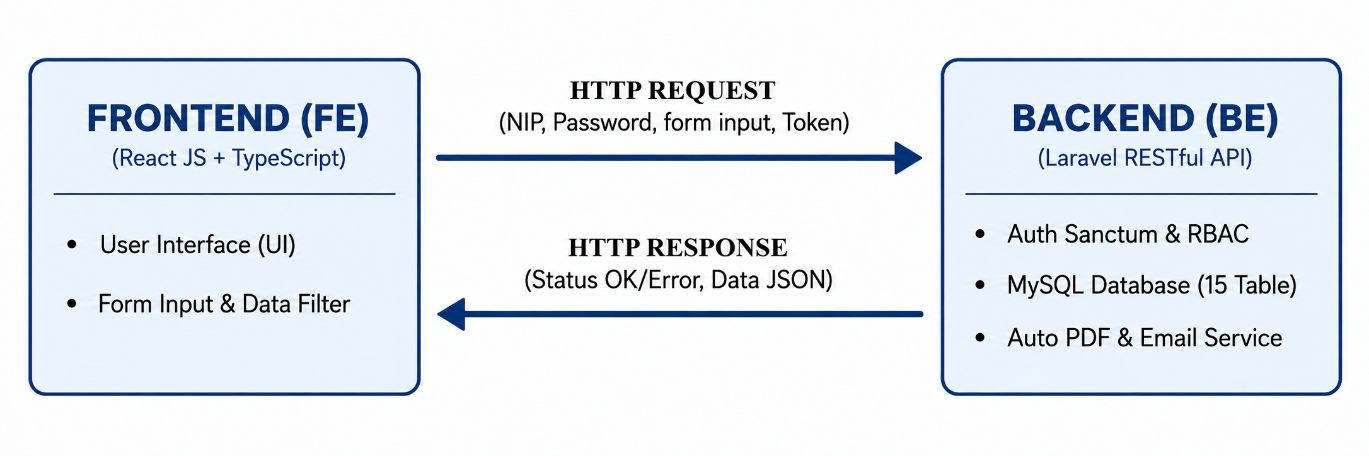
REST was used as the application communication model because it provides a standardized interface between client-side and server-side components and is well suited to modular information-system architectures. Comparative API research indicates that REST can provide practical performance for information-intensive applications, although relative performance depends on workload, implementation, and comparison conditions [17]. REST is therefore treated here as an architectural mechanism supporting component separation and structured data exchange, not as evidence of superior system performance. The study did not include comparative API benchmarking or production-load testing.
Access governance was implemented through Laravel Sanctum-based authentication combined with role middleware. Authentication determines whether a user can establish an authorized session, whereas role middleware restricts functions according to organizational responsibilities, in line with role-based access-control principles [16].
At the data layer, the retained relational schema documents primary and foreign keys across user, master-data, operational, waste-bank, reporting, and activity-log entities. User accounts include a unique username/NIP constraint, controlled role values define authorization categories, and master tables provide shared reference values across operational modules. The documented application flow indicates that input validation occurs before records are committed to the database. These mechanisms support referential integrity and consistency but do not independently establish the factual correctness or completeness of data entered by users.
Traceability was supported through the log_aktivitas audit-trail structure. Each documented log entry contains a unique identifier, a foreign key referencing the responsible user, an action category documented for LOGIN, CREATE, UPDATE, or DELETE operations, the associated application module, a free-text activity description, and a created_at timestamp. The corresponding interface exposes chronological records containing user identity, time, action type, activity details, and agency context, with retrieval and search functionality. Functional scenario T09 verifies that chronological activity records can be retrieved and displayed.
The available test records do not include transaction-level checks linking every specific create, update, or delete operation to its exact resulting audit-log row. The results confirm that an audit mechanism was implemented and its records retrieved, but not complete provenance verification for every database transaction. Table 2 summarizes the implemented integrity and provenance controls together with the claim boundary associated with each control.
|
Control |
Evidence in retained implementation record |
Claim boundary |
|---|---|---|
|
Primary/foreign keys |
Relational identifiers connect users, sub-districts, waste types, TPA, operational records, reports, waste-bank entities, and logs. |
Supports referential structure; does not prove factual correctness. |
|
Unique user identifier |
Username/NIP is documented as unique in the user schema. |
Prevents duplicate login identifiers, not all semantic duplicates. |
|
Controlled values |
Role is constrained to documented role values; waste categories and areas are supplied through master data. |
Improves consistency where controlled lists are used. |
|
Application validation |
Activity-flow documentation states that data are validated before database storage. |
A complete field-by-field Laravel validation-rule listing is not retained in the article record. |
|
Audit trail |
User FK, action, module, detail, and timestamp are stored; log page supports chronological retrieval. |
Enables attribution/retrieval; paired CRUD-to-log assertion was not preserved. |
|
Source provenance |
Planning/agency sources are identified at study level and operational records are user-linked where documented. |
No universal source_document/source_reference field is documented for every operational row. |
Together, these controls provide several complementary layers of data governance. Authentication and authorization regulate who can interact with particular functions; relational constraints organize how records are connected; controlled master data support consistency across modules; application validation governs data entry before storage; and activity logging provides an attributable history of recorded actions. The architecture therefore embeds data governance and administrative accountability into routine system interaction. The empirical evidence in this study establishes the implementation and selected functional verification of these mechanisms, while stronger claims regarding security resilience, complete transaction provenance, data accuracy, or production-scale reliability would require dedicated evaluation beyond the present study.
2.4 Functional Conformance Evaluation
Functional conformance was assessed through 25 requirements-based black-box test scenarios. Each scenario specified a module/requirement, authorized user role, input or action, expected output, and recorded pass/fail result. The test matrix includes a negative authentication case (T02: incorrect password or empty required login field). It does not document a systematic boundary-value suite across every form; this is therefore not claimed. The complete matrix is reported in Appendix A (Table A1) rather than only as aggregate domain counts.
The test matrix comes from the first author’s software-development project record. The archive does not identify a separate independent tester; tester independence is therefore not claimed, and the Black Box results are treated as functional verification associated with the development process. A scenario was classified as passed when its recorded behavior matched the expected result. The pass rate is the number of passing scenarios divided by the 25 executed scenarios. Because the set is requirement-based rather than a random sample of software states, 100% conformance describes only those executed cases.
2.5 Perceived Usability: Participants, Administration Record, and Statistical Analysis
Perceived usability was measured with the standard 10-item System Usability Scale (SUS), which provides a global rating of perceived system usability [18], [19]. The retained development report indicates that the questionnaire was distributed to 15 prospective users representing administrative, operational, supervisory, leadership, and waste-bank-related functions. However, only 10 complete participant-level SUS scoring records were retained in the study archive. The analytical sample was therefore restricted to these 10 complete records.
The complete records represented a range of organizational responsibilities, including operational staff, a unit head, supervisory and control functions, administrative personnel, and the agency secretary. Table 3 reports the organizational role and participant-level SUS score for each complete record. No aggregate result was reported for all 15 prospective participants because the remaining five questionnaires or item-level scoring records are unavailable.
|
Participant |
Organizational role |
SUS score |
|---|---|---|
|
P01 |
PSLB3 unit staff |
62.5 |
|
P02 |
Head of PSLB3 unit |
75.0 |
|
P03 |
PSLB3 unit staff |
75.0 |
|
P04 |
Staff |
50.0 |
|
P05 |
DLH staff |
67.5 |
|
P06 |
Environmental supervisor |
50.0 |
|
P07 |
Functional supervisor |
80.0 |
|
P08 |
Environmental impact controller |
65.0 |
|
P09 |
Administrative staff |
80.0 |
|
P10 |
Agency secretary |
77.5 |
The retained study record does not preserve sufficient procedural metadata to characterize the usability administration as a standardized task-based experiment. Specifically, it does not document a recruitment procedure, participants’ prior experience with comparable digital systems, duration of SIPEDAS exposure or training, completion of a common task script before the questionnaire, the interval between system use and SUS administration, whether assistance was provided during questionnaire completion, or a formal translation/adaptation record for the questionnaire wording. These undocumented factors were not used to explain differences among respondents.
These omissions do not change the descriptive statistics calculated from the 10 available SUS scores, but they limit interpretation of the usability context, comparability across participants, and any attempt to attribute score variation to specific user or administration characteristics. The available data provide evidence of perceived usability among the 10 documented participants under the study conditions; they do not establish first-use learnability, routine-use experience, training effectiveness, or role-dependent usability.
SUS scores were calculated using the standard scoring procedure [19]. For each odd-numbered item, 1 was subtracted from the response; for each even-numbered item, the response was subtracted from 5. The adjusted item contributions were summed and multiplied by 2.5 to yield a conventional 0–100 score.
Statistical analysis was conducted at the participant level. Descriptive statistics included the arithmetic mean, sample standard deviation, standard error, median, first and third quartiles, minimum, maximum, and observed range. An exploratory two-sided 95% t interval was calculated for the sample mean. Because the retained documentation does not establish probability-based sampling, the interval is interpreted as a description of uncertainty around the observed sample mean rather than as population-level inference.
SUS results were interpreted against a reference benchmark rather than assigned categorical labels. Scores were considered relative to the widely cited historical SUS benchmark of approximately 68 [18], while adjective classifications were treated cautiously because they can overstate the precision and substantive meaning of a single score [20]. Institutional operational permission and informed consent are documented in the retained record; however, no preserved formal ethics-committee approval, exemption, or waiver determination is available, and institutional permission is not treated as equivalent to research-ethics review.
2.6 Claim-Evidence Calibration
The evaluation distinguished system implementation, functional verification, perceived usability, actual use, and organizational outcomes as different levels of evidence. Conclusions were limited to the outcomes directly measured.
Requirement-derived Black Box testing was used to determine whether executed scenarios produced their predefined expected outputs. These results support claims about functional conformance under the documented test conditions, but do not establish the absence of software defects or validate characteristics not specifically tested.
The SUS assessment was used exclusively to characterize participants’ perceived usability of SIPEDAS. SUS scores were not interpreted as direct measures of task performance, productivity, learnability, adoption, organizational effectiveness, or public-service quality. Variation in participant scores was not causally attributed to role, digital literacy, exposure duration, or workflow experience because the corresponding explanatory variables were not retained.
No pre/post measurements were available for reporting time, data-entry accuracy, staff productivity, decision quality, data completeness, organizational efficiency, or other service-level outcomes. Technical evaluation also did not include dedicated load/performance benchmarking, penetration-security testing, reliability testing, recovery testing, or scalability assessment. No benefits were inferred for these unmeasured outcomes.
The resulting evidence hierarchy is as follows: implemented mechanisms indicate what the system was designed to provide; functional tests establish how selected workflows behaved under executed conditions; SUS scores characterize perceived usability among documented participants; and actual use or organizational net benefits require additional behavioral, longitudinal, or comparative evidence.
3. Results
3.1 Implementation and Workflow Integration (RQ1)
In response to RQ1, the completed SIPEDAS application consolidated the principal administrative workflows identified during requirements analysis into one role-controlled web environment. The operational dashboard presents summary statistics and graphical views of waste-management records, while master and transaction modules provide structured forms and searchable tables. The modules also share a common data context: sub-district, waste-type, landfill, source, infrastructure, and user records support operational transactions and reporting rather than remaining isolated in separate files. The system supports domestic and non-domestic transportation records, landfill handling, waste reduction, unhandled-waste monitoring, waste-bank information, sub-district and population data, landfill master data, source and infrastructure records, waste-generation estimates, reports, notifications, account management, and activity logs. Figure 3 shows the integrated operational dashboard that exposes the consolidated data as monitoring indicators and visual summaries.
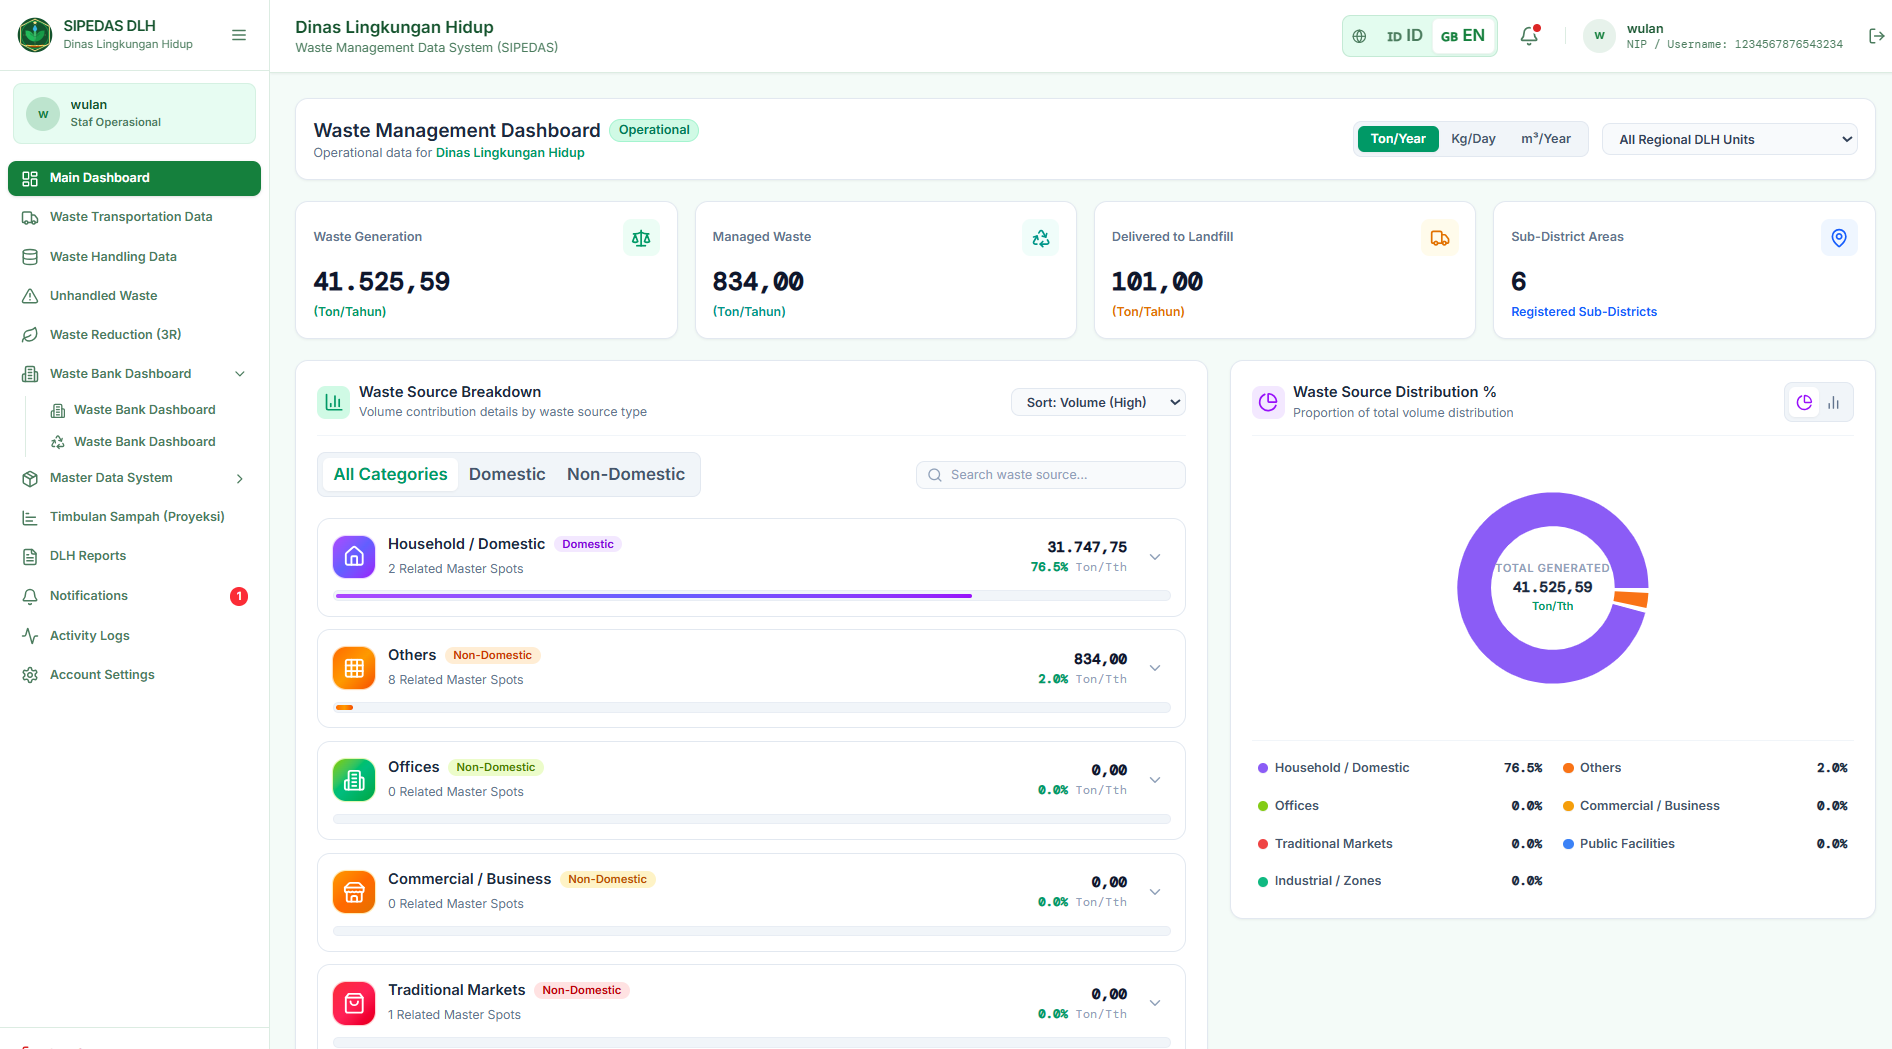
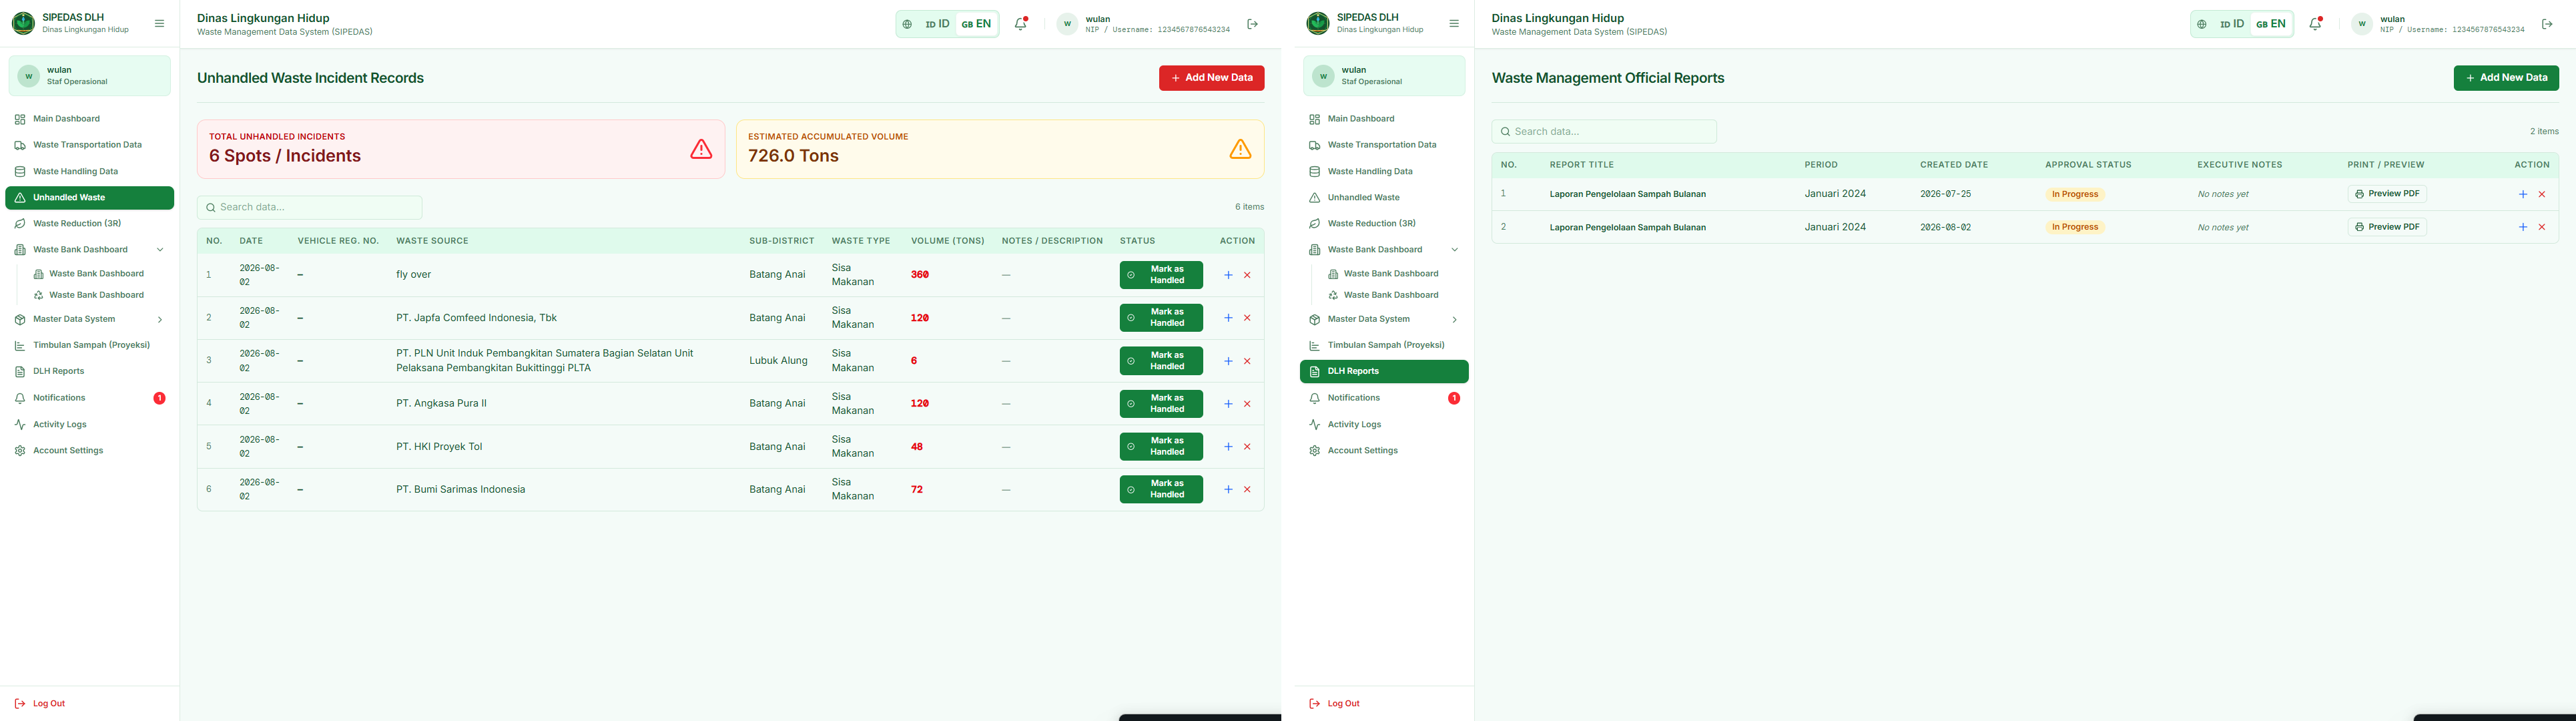
The reporting workflow allows users to select periods and administrative areas, consolidate recorded data, preview official reports, and export them as PDF files. Unhandled-waste records can be monitored separately, including location, estimated accumulated volume, and follow-up status. Because these functions draw on the same centralized database, the implemented workflow removes the need for a separate recapitulation layer inside the application and provides a traceable path from operational entry to reporting. This describes the implemented workflow; the study did not measure the amount of staff time saved relative to the previous workflow. Figure 4 illustrates representative monitoring and report-management interfaces that implement this integrated workflow.
3.2 Functional Conformance Results (RQ2)
All 25 requirement-derived functional scenarios produced the expected outputs (25/25), corresponding to a 100% pass rate for the executed cases. Coverage included authentication and session handling, administrator and user management, operational dashboard and master data, waste-management operations, waste-bank functions, and reporting/filtering/notification/export workflows. This finding addresses the functional-testing component of RQ2. These findings establish conformance for the executed cases but not the absence of defects or broader software reliability, security, or production readiness. Table 4 summarizes the executed scenarios and pass rates by functional domain.
|
Functional domain |
Scenarios executed |
Passed |
Pass rate |
|---|---|---|---|
|
Authentication and session |
3 |
3 |
100% |
|
Administrator and user management |
7 |
7 |
100% |
|
Operational dashboard and master data |
4 |
4 |
100% |
|
Waste-management operations |
6 |
6 |
100% |
|
Waste-bank functions |
3 |
3 |
100% |
|
Reporting, filtering, notification, and export |
2 |
2 |
100% |
|
Total |
25 |
25 |
100% |
|
ID |
Requirement/module |
Role |
Input/action |
Expected/observed outcome |
Status |
|---|---|---|---|---|---|
|
T01 |
Authentication |
Admin/Employee |
Valid credentials; Login |
Role-appropriate dashboard opened as expected |
Pass |
|
T02 |
Authentication – negative path |
Admin/Employee |
Incorrect password or required field empty |
Authentication error shown; no authenticated session opened |
Pass |
|
T09 |
Activity-log retrieval |
Admin |
Open Activity Log |
Chronological activity records retrieved and displayed |
Pass |
|
T14 |
Waste reduction |
Employee |
Add/edit/delete reduction record |
Requested record operation matched expected behavior |
Pass |
|
T23 |
Reports and filtering |
Employee |
Apply period and/or sub-district filter |
Report matched selected filter parameters |
Pass |
|
T24 |
Notification/PDF export |
Employee |
Invoke notification and/or PDF export |
Notification completed and PDF generated/downloadable |
Pass |
|
T25 |
Logout |
Admin/Employee |
Select Logout |
Session terminated and login page shown |
Pass |
3.3 Perceived Usability Results (RQ2)
The 10 participant-level SUS scores were 62.5, 75.0, 75.0, 50.0, 67.5, 50.0, 80.0, 65.0, 80.0, and 77.5. The mean was 68.25 (68.3 when rounded to one decimal place), with a sample standard deviation of 11.37 and standard error of 3.59. The median was 71.25, the first quartile was 63.13, and the third quartile was 76.88; scores ranged from 50 to 80. An exploratory 95% t interval for the mean was 60.12–76.38. The 30-point observed range and the width of the interval make the heterogeneity and limited precision of this small-sample usability estimate explicit. Table 6 reports the descriptive statistics supporting this interpretation.
|
Statistic |
Value |
|---|---|
|
Mean |
68.25 |
|
Sample standard deviation |
11.37 |
|
Standard error |
3.59 |
|
Median |
71.25 |
|
First quartile (Q1) |
63.13 |
|
Third quartile (Q3) |
76.88 |
|
Minimum |
50.00 |
|
Maximum |
80.00 |
|
Range |
30.00 |
|
Exploratory 95% t interval for mean |
60.12-76.38 |
The mean is close to the commonly cited SUS benchmark, but the 30-point range shows that experience was not uniform. Role labels alone do not provide a consistent explanation: both lower and higher scores occur among staff/supervisory positions. Because prior digital experience, task frequency, exposure time, and administration conditions were not retained, the observed heterogeneity cannot be causally attributed to those factors. It instead identifies a concrete need for task-based follow-up that observes navigation, terminology, feedback, data-entry sequence, and reporting interactions.
4. Discussion
4.1 Foundational Digital Integration as a Socio-Technical Capability
The principal finding is that SIPEDAS brought a multi-stage, file-based administrative process into a shared data and control workflow. SIPEDAS is therefore best understood as a socio-technical intervention connecting software components with roles, records, controls, and situated work practices [21]. The DeLone–McLean information-systems success model likewise distinguishes technical quality, user responses, use, and net benefits rather than treating implementation as a single outcome [22]. This study collected evidence at two levels—executed functional conformance and perceived usability—and did not test actual use or net benefits.
Municipal waste benchmarking has long identified gaps and inconsistencies in city-level information as obstacles to performance assessment [2], while recent municipal evaluation work emphasizes the quality and availability of waste information [11]. SIPEDAS operationalizes this requirement at agency level by connecting master data, transaction records, monitoring, and reporting through one database-backed workflow. Smart Waste Management 4.0 frameworks emphasize IoT, advanced analytics, automation, and integrated digital decision systems [4], while applied studies demonstrate intelligent monitoring based on connected devices and deep learning [13]. SIPEDAS uses a less technology-intensive approach, but it addresses a prerequisite for those capabilities: coherent records, defined responsibilities, and a governable data layer.
The comparison with the Bantul case is especially informative. Both systems report complete conformance across their executed Black Box scenarios [14], but SIPEDAS additionally makes the requirements-to-test mapping, participant-level SUS evidence, data-integrity controls, audit-trail boundaries, and claim-evidence hierarchy explicit. This comparison is used to differentiate evaluation transparency rather than to claim technological superiority. A recent socio-technical review likewise argues that digital waste technologies should be developed together with institutional and human capability [23]. These parallels suggest a possible sequence for system development, although the present study does not test a causal progression from foundational systems to advanced smart-waste technologies.
4.2 Traceability, Accountability, and Public-Service Workflow
Digital transformation is not merely the conversion of paper into electronic records; it involves changes to processes, responsibilities, and service arrangements [5]. In SIPEDAS, moving from individual files to a shared platform changes where records are stored, who can modify them, how actions are attributed, and how reports are assembled. Role-based permissions and audit logging therefore function as administrative controls rather than decorative security features. This interpretation is consistent with municipal-waste platform research linking digital information exchange with reduced fragmentation [12] and with a plastic-recycling case showing how a digital platform can support community engagement and social impact [24].
Public-administration research further characterizes public-sector digital transformation as an ongoing organizational-change process involving managers and frontline workers rather than a one-time software installation [25]. An ICT-enabled reclaimer case from Cape Town similarly illustrates how digital systems can reshape interactions within informal waste-recycling arrangements [26]. SIPEDAS did not directly measure accountability or organizational-change outcomes, so these features are interpreted as enabling mechanisms rather than proven governance improvements.
Centralization also does not guarantee data quality. The contribution of the SIPEDAS architecture lies in making data governance more manageable through referential structure, controlled master data, validation, role-based access, and activity logging. Factual accuracy, completeness, semantic duplication, and full source-level provenance remain separate quality dimensions requiring additional controls and auditing. This distinction is particularly important because the motivating case itself included divergent waste-generation estimates from different administrative sources.
4.3 Functional Conformance and Human Experience Are Distinct Outcomes
The combination of 25 passing functional scenarios and a 50–80 SUS score range is the most informative human-centered finding. The two measures answer different questions. Black Box testing establishes whether predefined workflows produced their expected observable outcomes under recorded conditions; SUS captures participants’ overall perception of the system. The coexistence of 25/25 functional conformance with a broad usability distribution therefore shows that implementation correctness coexisted with varied user experiences.
The mean SUS score of 68.25 is close to the broad historical benchmark reported in SUS research [18], while the exploratory 95% interval (60.12–76.38) and observed range (50–80) show that the estimate is imprecise and user experience was uneven. Bangor et al. [20] demonstrate that adjective interpretations vary across the score continuum and should be used cautiously. The most defensible interpretation is therefore perceived usability close to the benchmark among the respondents, with meaningful room for refinement, not uniformly 'good' or 'excellent' usability.
The participant role labels do not provide a simple explanation for this variation. Both lower and higher scores occur among staff and supervisory functions. Because prior digital experience, task frequency, exposure duration, training, and standardized task performance were not retained, the present data cannot identify why individual experiences differed. A useful next step is task-based evaluation of navigation paths, terminology comprehension, form-entry sequence, feedback visibility, report filtering, task success, time on task, errors, and assistance needs.
This distinction matters for routine administrative systems. A technically conformant platform can still create friction when navigation, terminology, feedback, or task sequence conflicts with work practices. Triangulating SUS with observed task performance and structured qualitative feedback would help explain differences in reported usability and guide interaction-design changes.
4.4 Transferable Design Implications
The case suggests three design implications, which require testing in other settings. First, foundational data integration should precede advanced automation when a public agency still relies on fragmented records: predictive analytics, IoT, or AI can only be as useful as the data and governance structures beneath them. Second, accountability should be designed into routine workflow through role assignment, traceable actions, controlled identifiers, and report provenance rather than added after deployment. Third, technical conformance, human experience, actual use, and organizational net benefits should be evaluated as distinct outcomes because a system can satisfy every executed functional scenario while remaining difficult for some users or producing no demonstrated service improvement.
These implications extend the case beyond Padang Pariaman by framing traceable public-service workflow design as a human-centered computing problem without claiming universal effectiveness. A practical approach for similar systems is to establish a traceable data backbone, embed governance controls in routine interaction, verify requirement-derived behavior, and then evaluate user experience and organizational outcomes with methods suited to those distinct levels of evidence.
4.5 Limitations and Future Research
Several limitations constrain interpretation. The study was conducted in one local-government agency. The requirements archive does not preserve a complete interview-participant roster or formal validation sign-off. The 25 Black Box scenarios were developer-associated requirement checks rather than documented independent verification, and systematic boundary testing was not preserved. The SUS analysis uses only 10 complete records and lacks prior-experience, exposure-duration, standardized-task, timing, assistance, and formal translation metadata. Formal ethics approval/exemption/waiver documentation is not preserved, although institutional operational permission and informed consent are documented. The study contains no pre/post organizational outcomes or dedicated technical security, performance, reliability, recovery, or scalability benchmarks.
Future research should move from implementation evidence toward comparative, task-based, and longitudinal evidence. Priority extensions include larger multi-role samples; moderated usability sessions; accessibility evaluation; measurement of task success, time, and errors; performance and security testing; backup-and-recovery validation; and prospective assessment of reporting effort, data completeness, and decision-support use. Multi-site replication should test whether the workflow architecture and traceability mechanisms transfer across agencies with different staffing, infrastructure, governance maturity, and data practices. The existing RESTful API also provides a basis for mobile clients, external-system integration, and GIS functionality for spatial monitoring.
5. Conclusion
This study shows how fragmented local-government waste records can be organized into a centralized, role-controlled, and auditable workflow using SIPEDAS. All 25 requirement-derived Black Box scenarios matched their expected outputs under the recorded test conditions, while 10 complete SUS records yielded a mean of 68.25 (SD = 11.37; range = 50–80), indicating perceived usability close to the benchmark but with considerable variation among respondents. The contribution is a human-centered evaluation framework that links administrative limitations to implemented controls while separating functional conformance from perceived usability, actual use, and organizational net benefits. The findings support SIPEDAS as a functional foundation for traceable waste-data administration; they do not establish freedom from defects, efficiency gains, verified security or reliability, or broad generalizability. Stronger claims require task-based usability observation, technical benchmarking, larger multi-role samples, and longitudinal field evaluation.
Declarations
Author Contributions
Wulan Ainiyyah Puteri: Conceptualization; Methodology; Software; Investigation; Writing – Original Draft. Syafrijon: Data Curation; Writing – Review & Editing; Supervision. All authors have read and approved the final version of the manuscript.
Acknowledgments
The authors thank the management and operational staff of the Environmental Office (Dinas Lingkungan Hidup) of Padang Pariaman Regency, West Sumatra, for their cooperation and provision of operational context, as well as the Department of Electronics Engineering, Universitas Negeri Padang, for their academic support.
Funding
This research received no specific grant from any funding agency.
Competing Interests
The authors declare no competing interests.
Ethics Approval
The study involved noninterventional software evaluation and an adult professional-user usability questionnaire. Institutional operational permission from the Environmental Office of Padang Pariaman Regency and informed consent from participants were documented. However, the retained study record contains no formal ethics-committee approval, exemption, or waiver determination. Institutional permission is not equivalent to formal research-ethics review.
Informed Consent
Informed Consent was obtained from all participants before completion of the usability questionnaire.
Data Availability Statement
The data supporting the reported functional testing and usability results, together with system documentation and database schemas, are available from the corresponding author upon reasonable request, subject to institutional data-governance requirements.
Generative AI and AI-Assisted Technologies Statement
During manuscript preparation in July 2026, the authors used ChatGPT (OpenAI; GPT-5-series models) for language editing. All final wording was critically checked and revised by the human authors, who retain full responsibility for the accuracy, originality, and integrity of the manuscript.
Appendix A. Complete black box functional-conformance matrix
|
ID |
Requirement/module |
User role |
Input/action |
Expected result |
Observed record |
Status |
|---|---|---|---|---|---|---|
|
T01 |
Authentication |
Admin/Employee |
Valid NIP/username and password; select Login |
Role-appropriate dashboard opens |
Matched expected output; archival result recorded as compliant/valid |
Pass |
|
T02 |
Authentication - negative path |
Admin/Employee |
Incorrect password or required login field left empty; select Login |
Authentication error is shown; no authenticated session is opened |
Matched expected output; archival result recorded as compliant/valid |
Pass |
|
T03 |
Administrator dashboard |
Admin |
Open Dashboard after authenticated admin login |
Summary of employees, leadership, waste banks, and active accounts is displayed |
Matched expected output; archival result recorded as compliant/valid |
Pass |
|
T04 |
Agency master data |
Admin |
Add, edit, or delete agency data and confirm action |
Agency record is saved, updated, or deleted as requested |
Matched expected output; archival result recorded as compliant/valid |
Pass |
|
T05 |
Employee master data |
Admin |
Add, edit, or delete employee data |
Employee record is saved, updated, or deleted |
Matched expected output; archival result recorded as compliant/valid |
Pass |
|
T06 |
Leadership master data |
Admin |
Add, edit, or delete leadership data |
Leadership record is saved, updated, or deleted |
Matched expected output; archival result recorded as compliant/valid |
Pass |
|
T07 |
User accounts |
Admin |
Create account; set role/status; send credentials |
Account is created, status/role is applied, and credential-delivery action completes |
Matched expected output; archival result recorded as compliant/valid |
Pass |
|
T08 |
Email notification settings |
Admin |
Create or update notification template and save |
Notification template is stored/updated |
Matched expected output; archival result recorded as compliant/valid |
Pass |
|
T09 |
Activity log retrieval |
Admin |
Open Activity Log |
Chronological activity records are retrievable and displayed |
Matched expected output; archival result recorded as compliant/valid |
Pass |
|
T10 |
Waste-management dashboard |
Employee/leadership view |
Open operational Dashboard |
Waste-management statistics and visual summaries are displayed |
Matched expected output; archival result recorded as compliant/valid |
Pass |
|
T11 |
Sub-district master data |
Employee |
Add, edit, or delete sub-district record |
Sub-district record is saved, updated, or deleted |
Matched expected output; archival result recorded as compliant/valid |
Pass |
|
T12 |
Waste-type master data |
Employee |
Add, edit, or delete waste-type record |
Waste-type record is saved, updated, or deleted |
Matched expected output; archival result recorded as compliant/valid |
Pass |
|
T13 |
Landfill master data |
Employee |
Add, edit, or delete TPA record |
TPA record is saved, updated, or deleted |
Matched expected output; archival result recorded as compliant/valid |
Pass |
|
T14 |
Waste reduction |
Employee |
Add, edit, or delete reduction record |
Reduction record is saved, updated, or deleted |
Matched expected output; archival result recorded as compliant/valid |
Pass |
|
T15 |
Waste handling |
Employee |
Add, edit, or delete handling record |
Handling/transport record is saved, updated, or deleted |
Matched expected output; archival result recorded as compliant/valid |
Pass |
|
T16 |
Unhandled waste |
Employee |
Add, edit, or delete unhandled-waste record |
Unhandled-waste record is saved, updated, or deleted |
Matched expected output; archival result recorded as compliant/valid |
Pass |
|
T17 |
Facilities and infrastructure |
Employee |
Add, edit, or delete facility/infrastructure record |
Facility/infrastructure record is saved, updated, or deleted |
Matched expected output; archival result recorded as compliant/valid |
Pass |
|
T18 |
Waste sources |
Employee |
Add, edit, or delete source record |
Waste-source record is saved, updated, or deleted |
Matched expected output; archival result recorded as compliant/valid |
Pass |
|
ID |
Requirement/module |
User role |
Input/action |
Expected result |
Observed record |
Status |
|---|---|---|---|---|---|---|
|
T19 |
Waste generation |
Employee |
Add, edit, or delete waste-generation estimate |
Waste-generation record is saved, updated, or deleted |
Matched expected output; archival result recorded as compliant/valid |
Pass |
|
T20 |
Waste-bank profile |
Employee |
Add, edit, or delete waste-bank profile |
Waste-bank record is saved, updated, or deleted |
Matched expected output; archival result recorded as compliant/valid |
Pass |
|
T21 |
Waste-bank processing |
Employee |
Add, edit, or delete processed-waste record |
Waste-bank processing record is saved, updated, or deleted |
Matched expected output; archival result recorded as compliant/valid |
Pass |
|
T22 |
Waste-bank customer |
Employee |
Add, edit, or delete customer record |
Customer record is saved, updated, or deleted |
Matched expected output; archival result recorded as compliant/valid |
Pass |
|
T23 |
Reports and filtering |
Employee |
Choose reporting period and/or sub-district and apply filter |
Recapitulated report matches selected filter parameters |
Matched expected output; archival result recorded as compliant/valid |
Pass |
|
T24 |
Notification/PDF export |
Employee |
Open report; invoke notification and/or PDF export |
Notification action completes and PDF file is generated/downloadable |
Matched expected output; archival result recorded as compliant/valid |
Pass |
|
T25 |
Logout |
Admin/Employee |
Select Logout |
Authenticated session terminates and login page is shown |
Matched expected output; archival result recorded as compliant/valid |
Pass |
Interpretation boundary. The matrix documents conformance of the 25 recorded scenarios only. It does not constitute a systematic boundary-value suite, penetration-security test, load/performance benchmark, reliability assessment, or independent production-readiness certification.
References
- Z. Zhang, Z. Chen, J. Zhang, Y. Liu, L. Chen, M. Yang, A. I. Osman, M. Farghali, E. Liu, D. Hassan, I. Ihara, K. Lu, D. W. Rooney, and P.-S. Yap, “Municipal solid waste management challenges in developing regions: A comprehensive review and future perspectives for Asia and Africa,” Sci. Total Environ., vol. 930, Art. no. 172794, 2024, doi: 10.1016/j.scitotenv.2024.172794.
- D. C. Wilson, L. Rodic, M. J. Cowing, C. A. Velis, A. D. Whiteman, A. Scheinberg, R. Vilches, D. Masterson, J. Stretz, and B. Oelz, “‘Wasteaware’ benchmark indicators for integrated sustainable waste management in cities,” Waste Manag., vol. 35, pp. 329–342, 2015, doi: 10.1016/j.wasman.2014.10.006.
- Y. A. Fatimah, K. Govindan, R. Murniningsih, and A. Setiawan, “Industry 4.0 based sustainable circular economy approach for smart waste management system to achieve sustainable development goals: A case study of Indonesia,” J. Clean. Prod., vol. 269, Art. no. 122263, 2020, doi: 10.1016/j.jclepro.2020.122263.
- D. Kannan, S. Khademolqorani, N. Janatyan, and S. Alavi, “Smart waste management 4.0: The transition from a systematic review to an integrated framework,” Waste Manag., vol. 174, pp. 1–14, 2024, doi: 10.1016/j.wasman.2023.08.041.
- I. Mergel, N. Edelmann, and N. Haug, “Defining digital transformation: Results from expert interviews,” Gov. Inf. Q., vol. 36, no. 4, Art. no. 101385, 2019, doi: 10.1016/j.giq.2019.06.002.
- J. J. Pittaway and A. R. Montazemi, “Know-how to lead digital transformation: The case of local governments,” Gov. Inf. Q., vol. 37, no. 4, Art. no. 101474, 2020, doi: 10.1016/j.giq.2020.101474.
- L. Tangi, M. Janssen, M. Benedetti, and G. Noci, “Digital government transformation: A structural equation modelling analysis of driving and impeding factors,” Int. J. Inf. Manag., vol. 60, Art. no. 102356, 2021, doi: 10.1016/j.ijinfomgt.2021.102356.
- Dinas Lingkungan Hidup, Perumahan, Kawasan Permukiman dan Pertanahan Kabupaten Padang Pariaman, “Data and administrative records on waste management and 2024 regional waste performance,” unpublished internal institutional records, Padang Pariaman, Indonesia, 2025.
- Pemerintah Kabupaten Padang Pariaman, Dokumen Perencanaan Teknis dan Manajemen Persampahan (PTMP) Kabupaten Padang Pariaman. Padang Pariaman, Indonesia, 2016.
- T.-D. Bui, J.-W. Tseng, M.-L. Tseng, K.-J. Wu, and M. K. Lim, “Municipal solid waste management technological barriers: A hierarchical structure approach in Taiwan,” Resour. Conserv. Recycl., vol. 190, Art. no. 106842, 2023, doi: 10.1016/j.resconrec.2022.106842.
- I. Giraldo-Almario, G. Rueda-Saa, and J. R. Uribe-Ceballos, “Wasteaware adaptation to the context of a Latin American country: Evaluation of the municipal solid waste management in Cali, Colombia,” J. Mater. Cycles Waste Manag., vol. 26, pp. 908–922, 2024, doi: 10.1007/s10163-023-01868-5.
- L. Mersico, S. Aureli, and E. Foschi, “Exploring the role of digital platforms in promoting value co-creation: Evidence from the Italian municipal solid waste management system,” Sustain. Account. Manag. Policy J., vol. 17, no. 1, pp. 233–266, 2026, doi: 10.1108/SAMPJ-03-2024-0317.
- C. Wang, J. Qin, C. Qu, X. Ran, C. Liu, and B. Chen, “A smart municipal waste management system based on deep-learning and Internet of Things,” Waste Manag., vol. 135, pp. 20–29, 2021, doi: 10.1016/j.wasman.2021.08.028.
- D. Yulianto and A. Febrianto, “Sistem Informasi Pengelolaan Sampah Kabupaten Bantul Berbasis Website Menggunakan Model Modified Waterfall,” Technomedia J., vol. 9, no. 3, pp. 309–320, 2025, doi: 10.33050/tmj.v9i3.2168.
- I. Sommerville, Software Engineering, 9th ed. Boston, MA, USA: Addison-Wesley, 2011.
- R. S. Sandhu, E. J. Coyne, H. L. Feinstein, and C. E. Youman, “Role-based access control models,” Computer, vol. 29, no. 2, pp. 38–47, 1996, doi: 10.1109/2.485845.
- A. Lawi, B. L. E. Panggabean, and T. Yoshida, “Evaluating GraphQL and REST API services performance in a massive and intensive accessible information system,” Computers, vol. 10, no. 11, Art. no. 138, 2021, doi: 10.3390/computers10110138.
- J. R. Lewis, “The System Usability Scale: Past, present, and future,” Int. J. Hum.-Comput. Interact., vol. 34, no. 7, pp. 577–590, 2018, doi: 10.1080/10447318.2018.1455307.
- J. Brooke, “SUS: A ‘quick and dirty’ usability scale,” in Usability Evaluation in Industry, P. W. Jordan, B. Thomas, B. A. Weerdmeester, and I. L. McClelland, Eds. London, U.K.: Taylor & Francis, 1996, pp. 189–194, doi: 10.1201/9781498710411-35.
- A. Bangor, P. T. Kortum, and J. T. Miller, “Determining what individual SUS scores mean: Adding an adjective rating scale,” J. Usability Stud., vol. 4, no. 3, pp. 114–123, 2009.
- G. Baxter and I. Sommerville, “Socio-technical systems: From design methods to systems engineering,” Interact. Comput., vol. 23, no. 1, pp. 4–17, Jan. 2011, doi: 10.1016/j.intcom.2010.07.003.
- W. H. DeLone and E. R. McLean, “The DeLone and McLean model of information systems success: A ten-year update,” J. Manage. Inf. Syst., vol. 19, no. 4, pp. 9–30, 2003, doi: 10.1080/07421222.2003.11045748.
- O. M. Hassan, “Integrated digital, biological, and human capital innovations for circular and sustainable waste management: A critical review,” Discov. Appl. Sci., vol. 7, Art. no. 1289, 2025, doi: 10.1007/s42452-025-07904-3.
- V. Mogha and N. Tebourbi, “Digital platform to scale initiatives for community engagement and social impact: A case study in the Indian plastic recycling industry,” J. Asia Bus. Stud., vol. 19, no. 3, pp. 586–605, 2025, doi: 10.1108/JABS-07-2024-0389.
- J. A. Nielsen, K. T. Elmholdt, and M. S. Noesgaard, “Leading digital transformation: A narrative perspective,” Public Adm. Rev., vol. 84, no. 4, pp. 589–603, 2024, doi: 10.1111/puar.13721.
- V. Siwawa, “Effect of the ICT-enabled reclaimer system on the informal waste recycling system in Cape Town, South Africa: The Regenize model,” Electron. J. Inf. Syst. Dev. Ctries., vol. 91, no. 1, Art. no. e12345, 2025, doi: 10.1002/isd2.12345.
Author Biographies

Wulan Ainiyyah Puteri is an undergraduate student in the Informatics Department at the Faculty of Engineering, Universitas Negeri Padang, Indonesia. Her academic interests and research focus lie in web application development and digital system design to solve practical problems in public institutions. In this study, she was fully responsible for the design and development of the Web-Based Waste Management Information System at the Environmental Department of Padang Pariaman Regency. Her primary contributions encompass system requirements analysis, database architecture design, and web interface implementation aimed at supporting centralized data administration, reporting consistency, traceable workflows, and improved information organization in regional waste administration.


Syafrijon is a lecturer in the Department of Electronics at Universitas Negeri Padang (UNP). He obtained a Bachelor's degree in Electrical Engineering from IKIP Padang in 1999, a Master's degree in Computer Science from Universitas Putra Indonesia YPTK in 2009, and a Doctoral degree in Chemistry from Universitas Andalas in 2019.



Publisher’s and Journal’s Note
Sagamedia Teknologi Nusantara, as the publisher and editor of the Journal of Hypermedia & Technology-Enhanced Learning (J-HyTEL), upholds the highest ethical standards in academic publishing. The journal remains neutral with regard to jurisdictional claims in published maps and institutional affiliations. Authors are fully responsible for the originality, accuracy, and integrity of their work. Post-publication ethical concerns will be addressed through corrections, clarifications, or retractions as necessary. The content of this publication has not been approved by the United Nations and does not reflect the views of the United Nations or its officials or Member States. https://www.un.org/sustainabledevelopment
Copyright & License

© 2026 Wulan Ainiyyah Puteri, Syafrijon. Authors retain copyright.
This article is licensed under a Creative Commons Attribution 4.0 International License, which permits use, sharing, adaptation, distribution, and reproduction in any medium or format, provided that appropriate credit is given to the original author(s) and the source, a link to the Creative Commons license is provided, and any modifications are indicated. Unless otherwise specified in a credit line, this article’s images or other third-party material are included under the Creative Commons license. If certain material is not covered by the article’s Creative Commons license and its intended use is not permitted by statutory regulation or exceeds the allowed usage, permission must be obtained directly from the copyright holder. http://creativecommons.org/licenses/by/4.0/.
Read the licence terms